Set Up EKS Cluster Monitoring
AlertD can monitor your Amazon EKS clusters — inspecting Kubernetes objects through the EKS API and analyzing cluster, node, pod, and container metrics from CloudWatch. Enabling this involves three things:
- Network access — AlertD must be able to reach the cluster’s Kubernetes API endpoint.
- An IAM access entry — grant the AlertD TaskRole read access to Kubernetes objects on the cluster.
- The CloudWatch Observability add-on — install the CloudWatch Agent so cluster metrics flow to CloudWatch, where AlertD reads them.
AlertD fetches EKS metrics from CloudWatch Metrics (Container Insights). The CloudWatch Observability add-on is what publishes those metrics from your cluster to CloudWatch.
Network access (required for private clusters)
Before AlertD can talk to your cluster, it needs network reachability to the EKS Kubernetes API server endpoint.
- Public endpoint clusters — no extra networking is required; AlertD reaches the API endpoint over the internet (subject to any allow-listed CIDRs on the endpoint).
- Private endpoint clusters — the API endpoint is only reachable from inside the cluster’s VPC. You must connect the VPC where AlertD is deployed to the VPC hosting your EKS cluster so traffic can route between them. Use either:
- Transit Gateway — attach both the AlertD VPC and the EKS VPC to a Transit Gateway and add routes between them. Best when you have several VPCs or accounts to connect.
- VPC Peering — create a peering connection between the AlertD VPC and the EKS VPC and add routes on both sides. Simplest for a one-to-one connection.
Ensure the two VPCs use non-overlapping CIDR ranges — overlapping ranges cannot be routed over Transit Gateway or VPC Peering. Also confirm the EKS cluster security group and any network ACLs allow inbound HTTPS (443) from the AlertD VPC CIDR.
Once routing is in place (or if your cluster uses a public endpoint), continue with the setup below.
Overview
Find the AlertD TaskRole ARN
Locate the IAM role AlertD runs as, via CloudFormation.
Create an IAM access entry
Grant the TaskRole read access to the cluster’s Kubernetes objects.
Add the CloudWatch Observability add-on
Publish cluster metrics to CloudWatch for AlertD to read.
Step 1: Find the AlertD TaskRole ARN
AlertD runs as an IAM role named TaskRole, created by the AlertD CloudFormation stack. You’ll grant this role access to your cluster.
- Open the CloudFormation console and select your AlertD stack.
- Open the Resources tab and search for
TaskRole. - Open the
TaskRoleresource (typeAWS::IAM::Role) and copy its ARN, for example:
arn:aws:iam::<account-id>:role/<stack-name>-TaskRole-<suffix>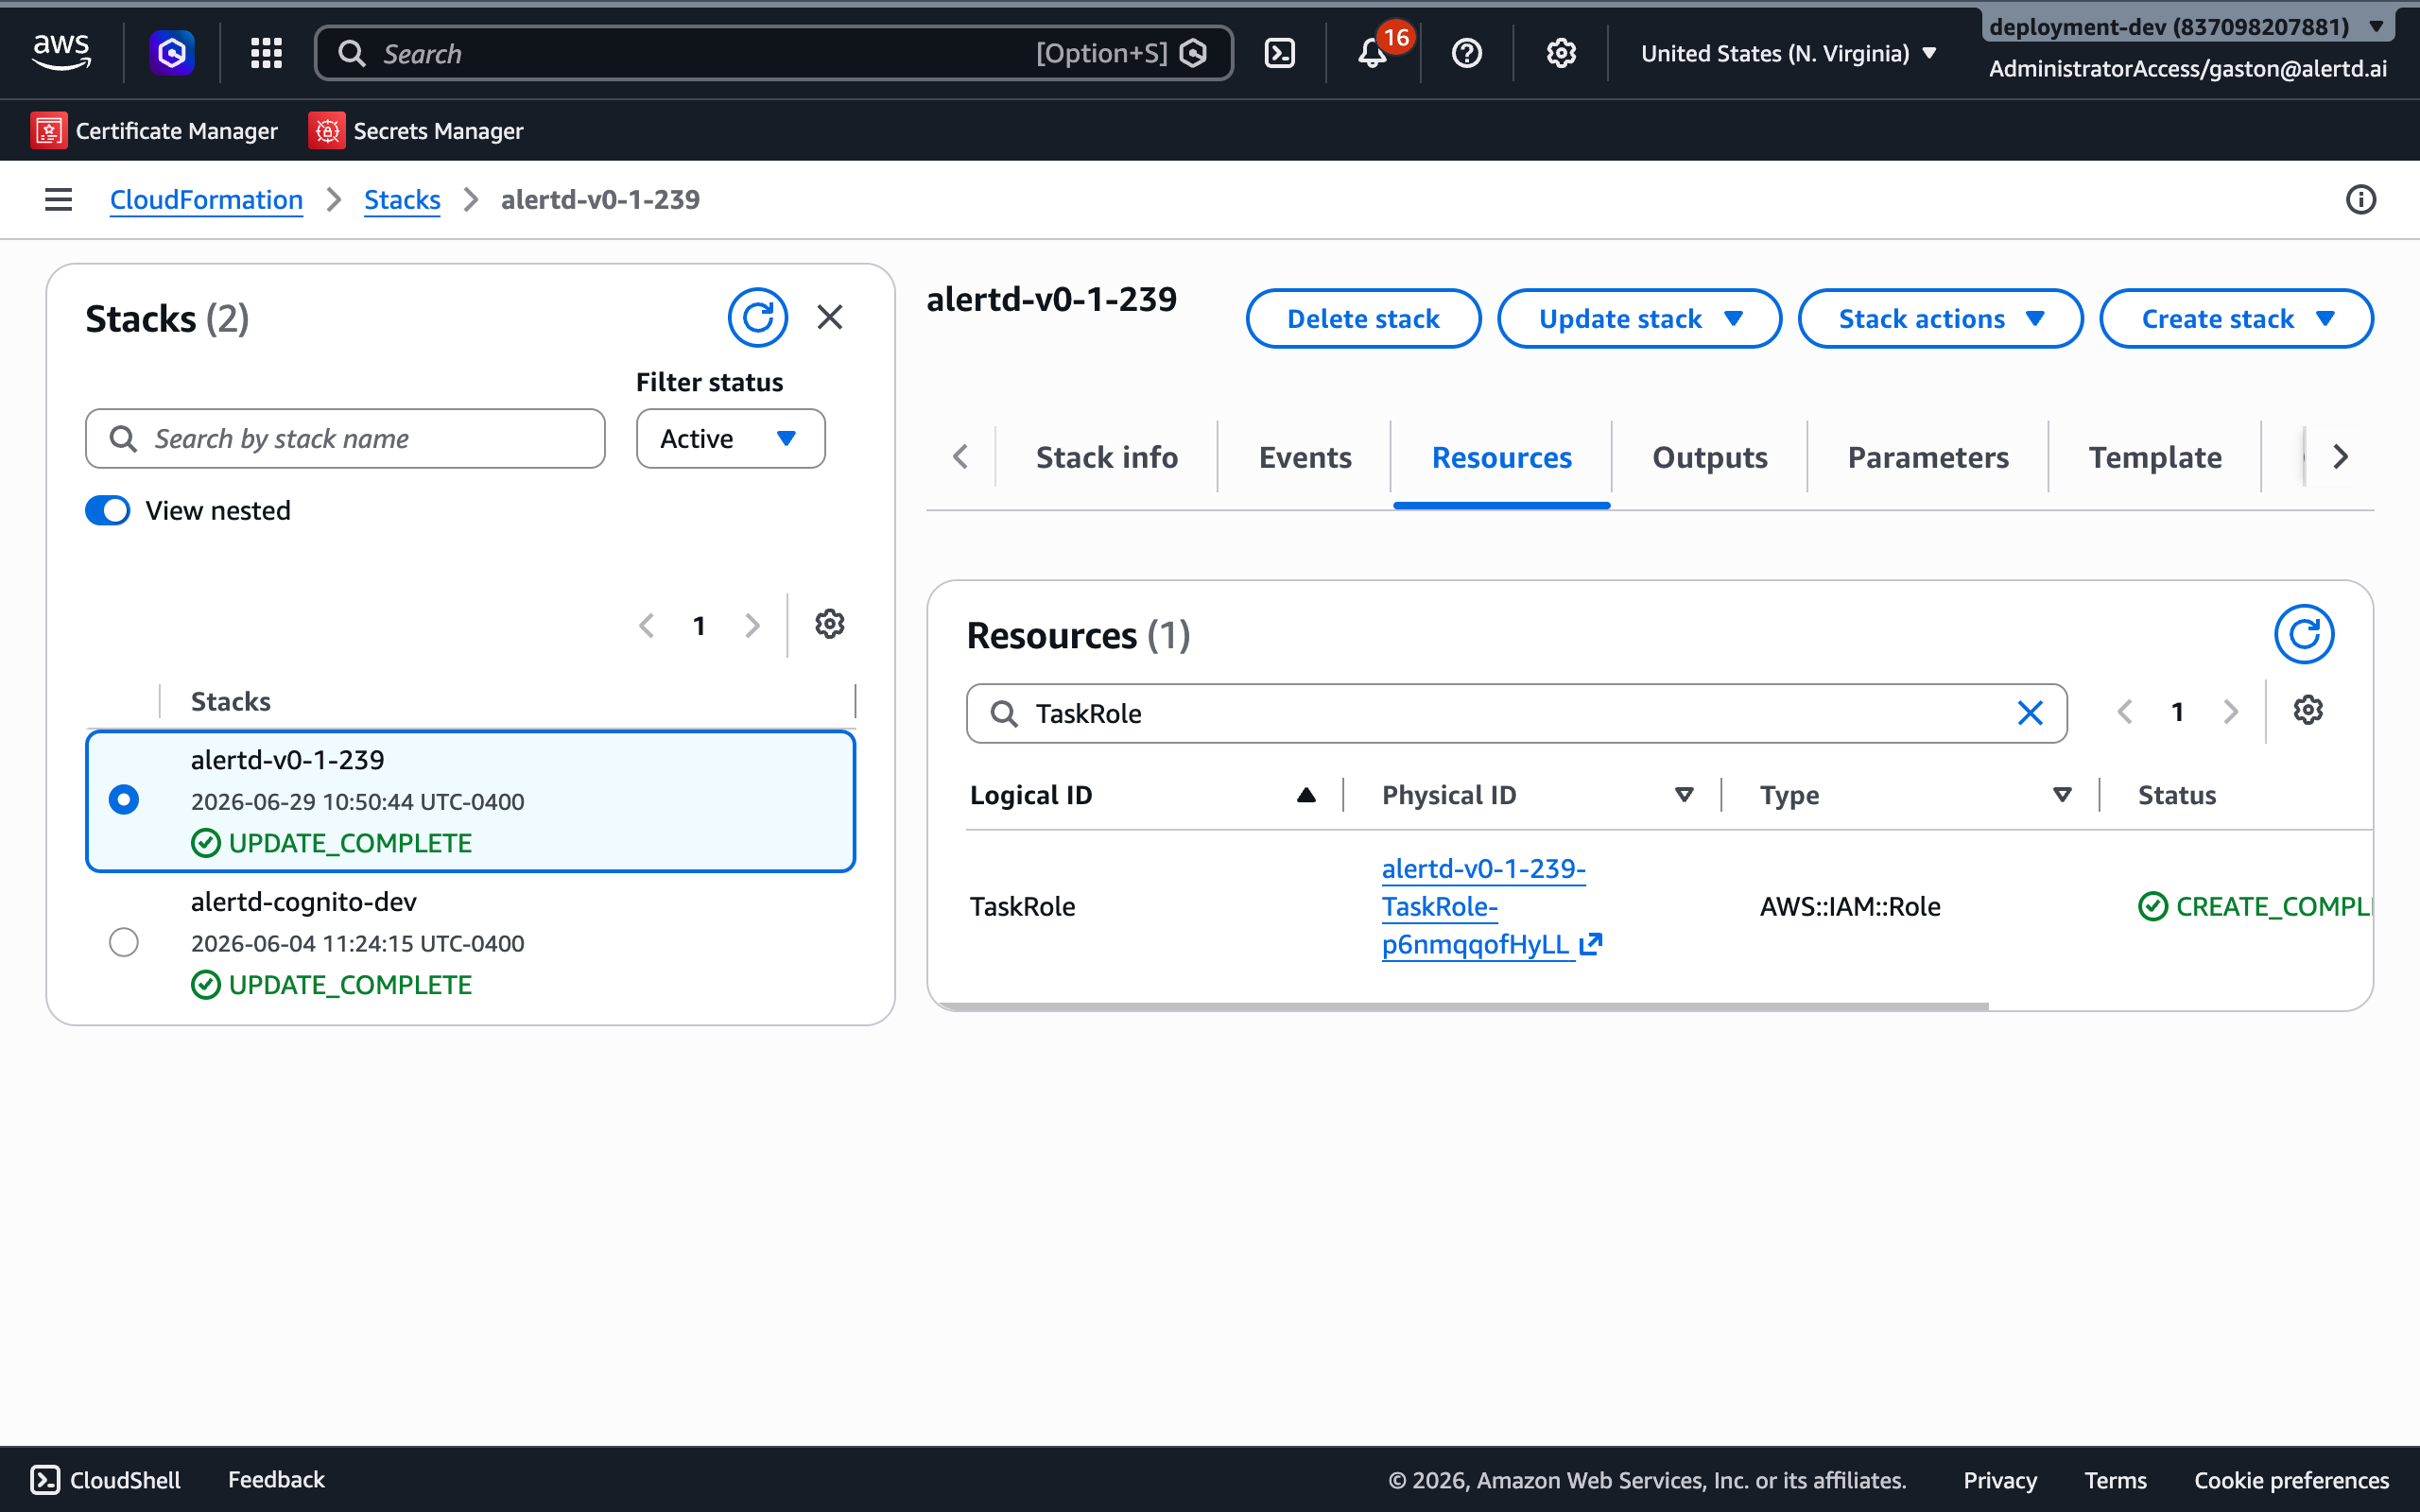
If the EKS cluster is in a different account than the AlertD deployment, this is the same TaskRole ARN you use elsewhere — grant it cross-account access to the cluster as shown below.
Step 2: Create an IAM access entry for the TaskRole
An IAM access entry maps an AWS IAM principal to Kubernetes permissions on the cluster. You’ll map the AlertD TaskRole to a read-only access policy.
Step 2.1: Open the cluster’s Access tab
- Open the Elastic Kubernetes Service (EKS) console and choose Clusters.
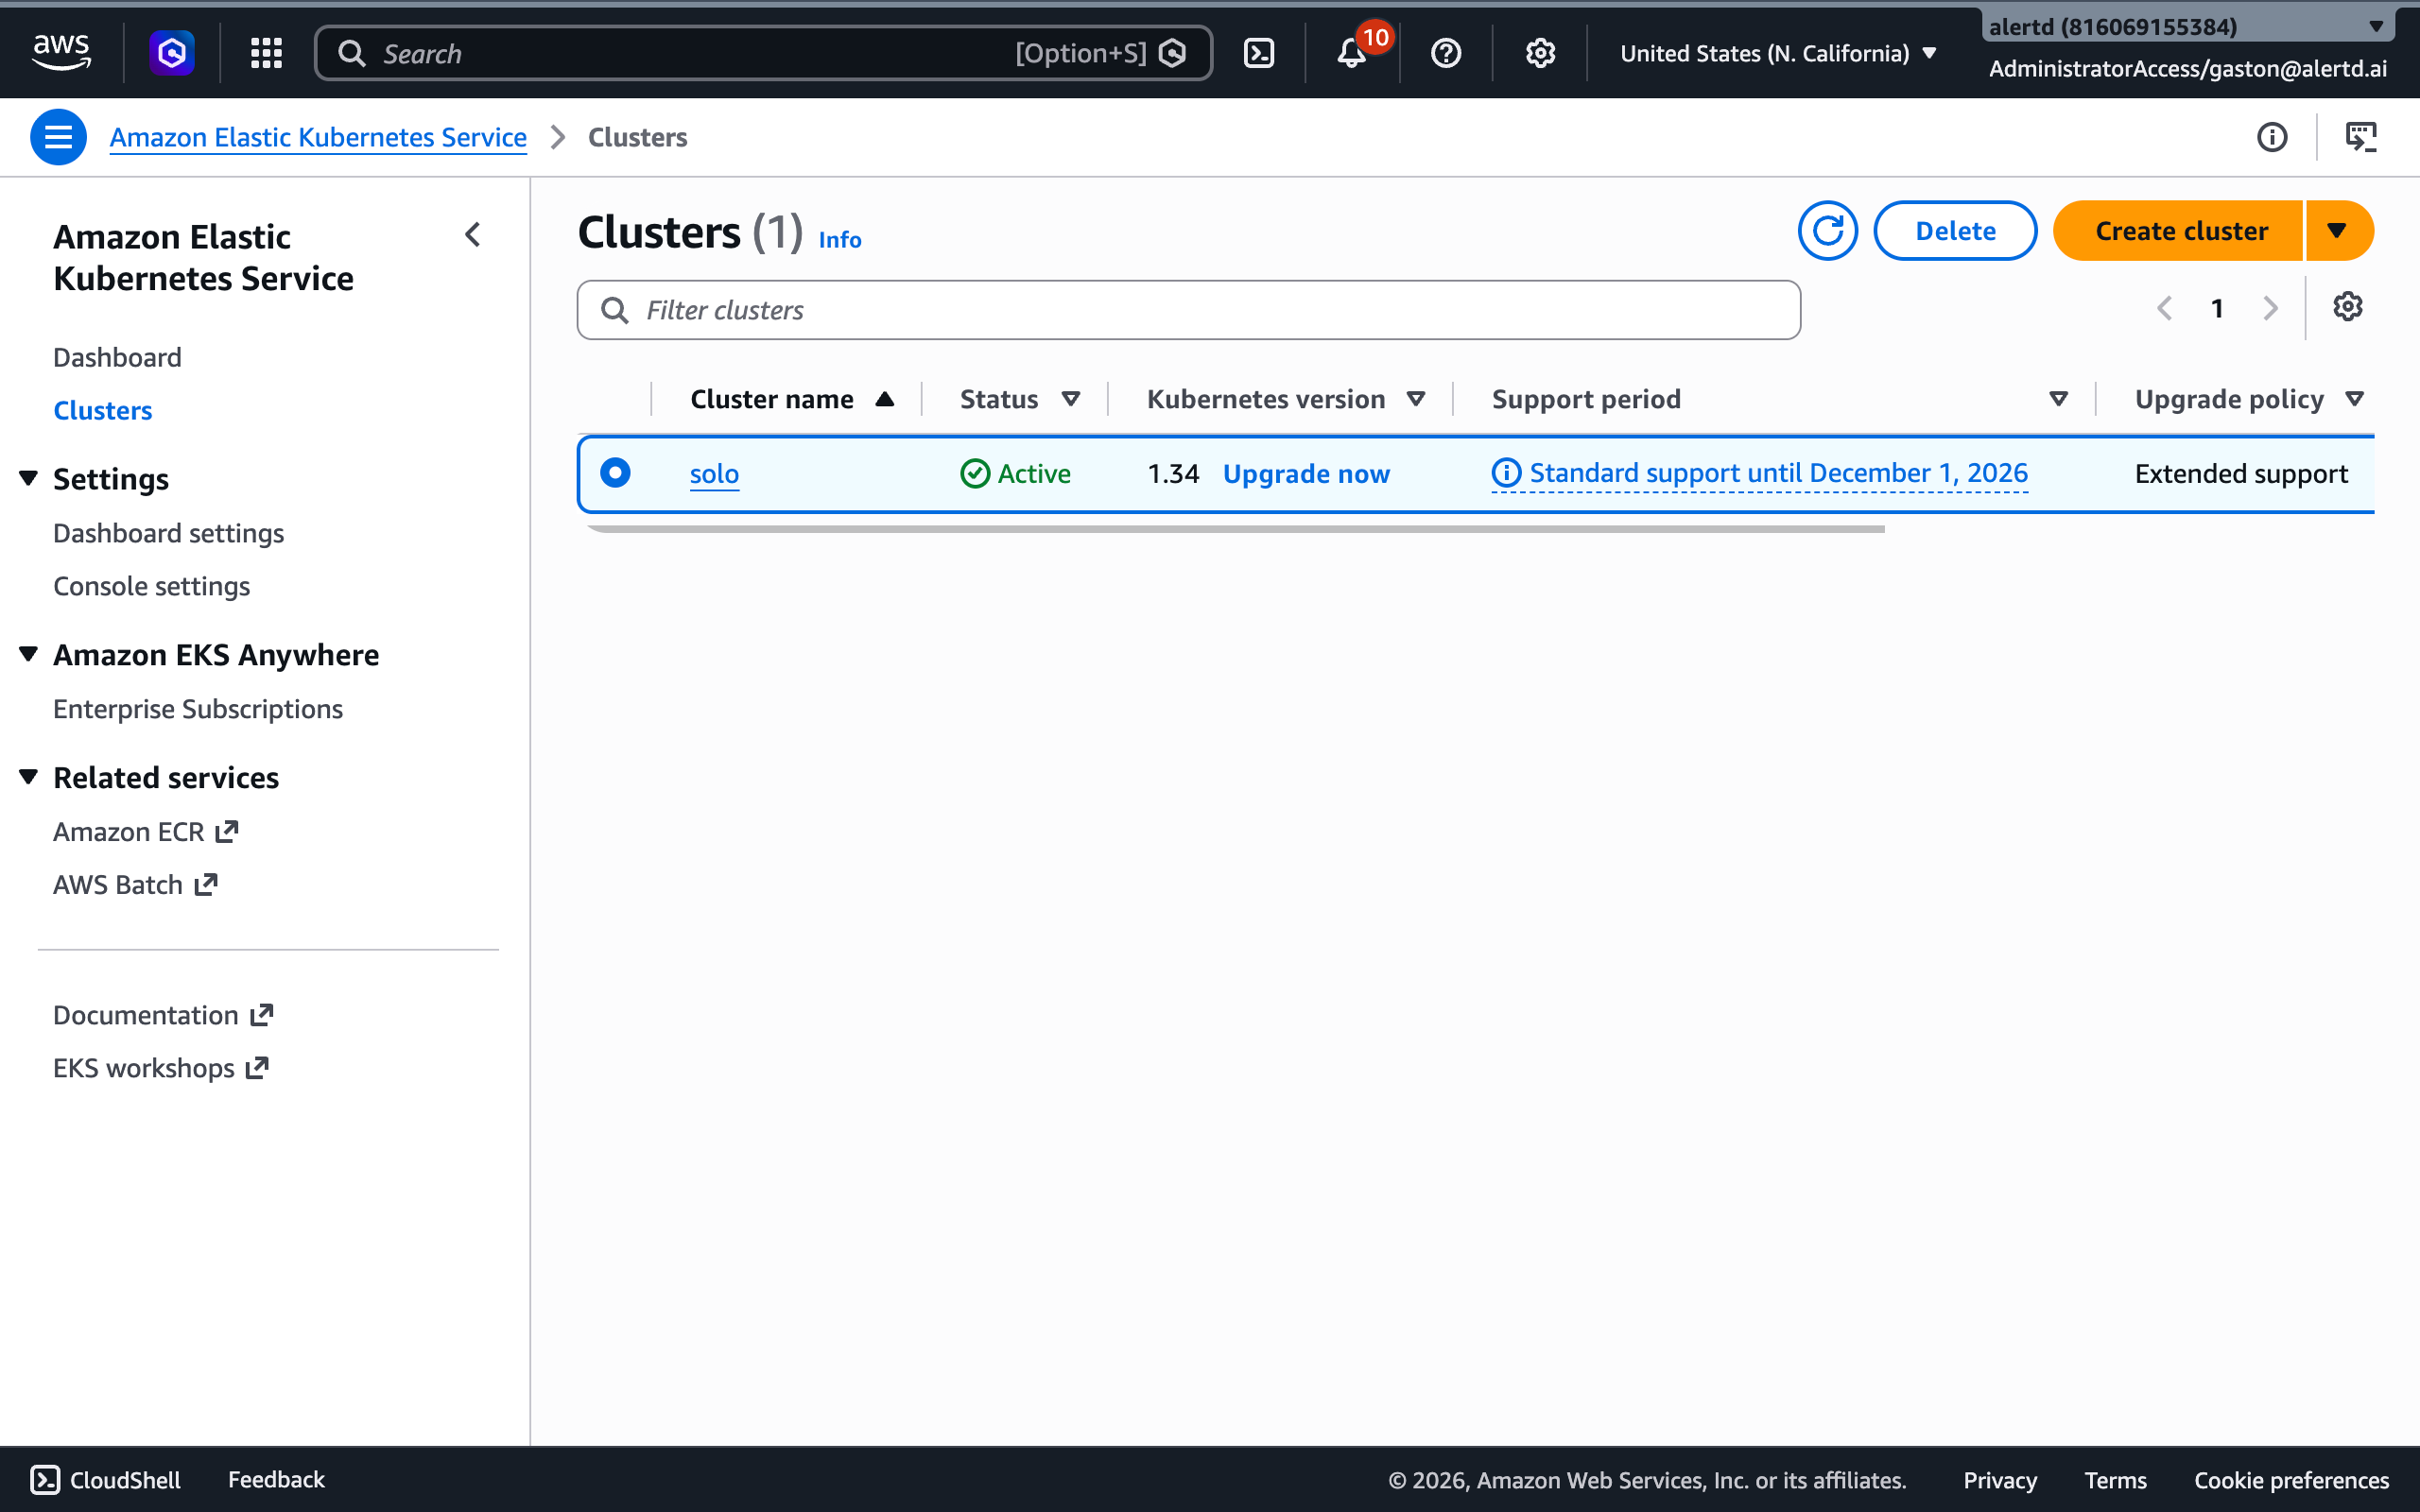
- Select your cluster, then open the Access tab. Under IAM access entries, choose Create.
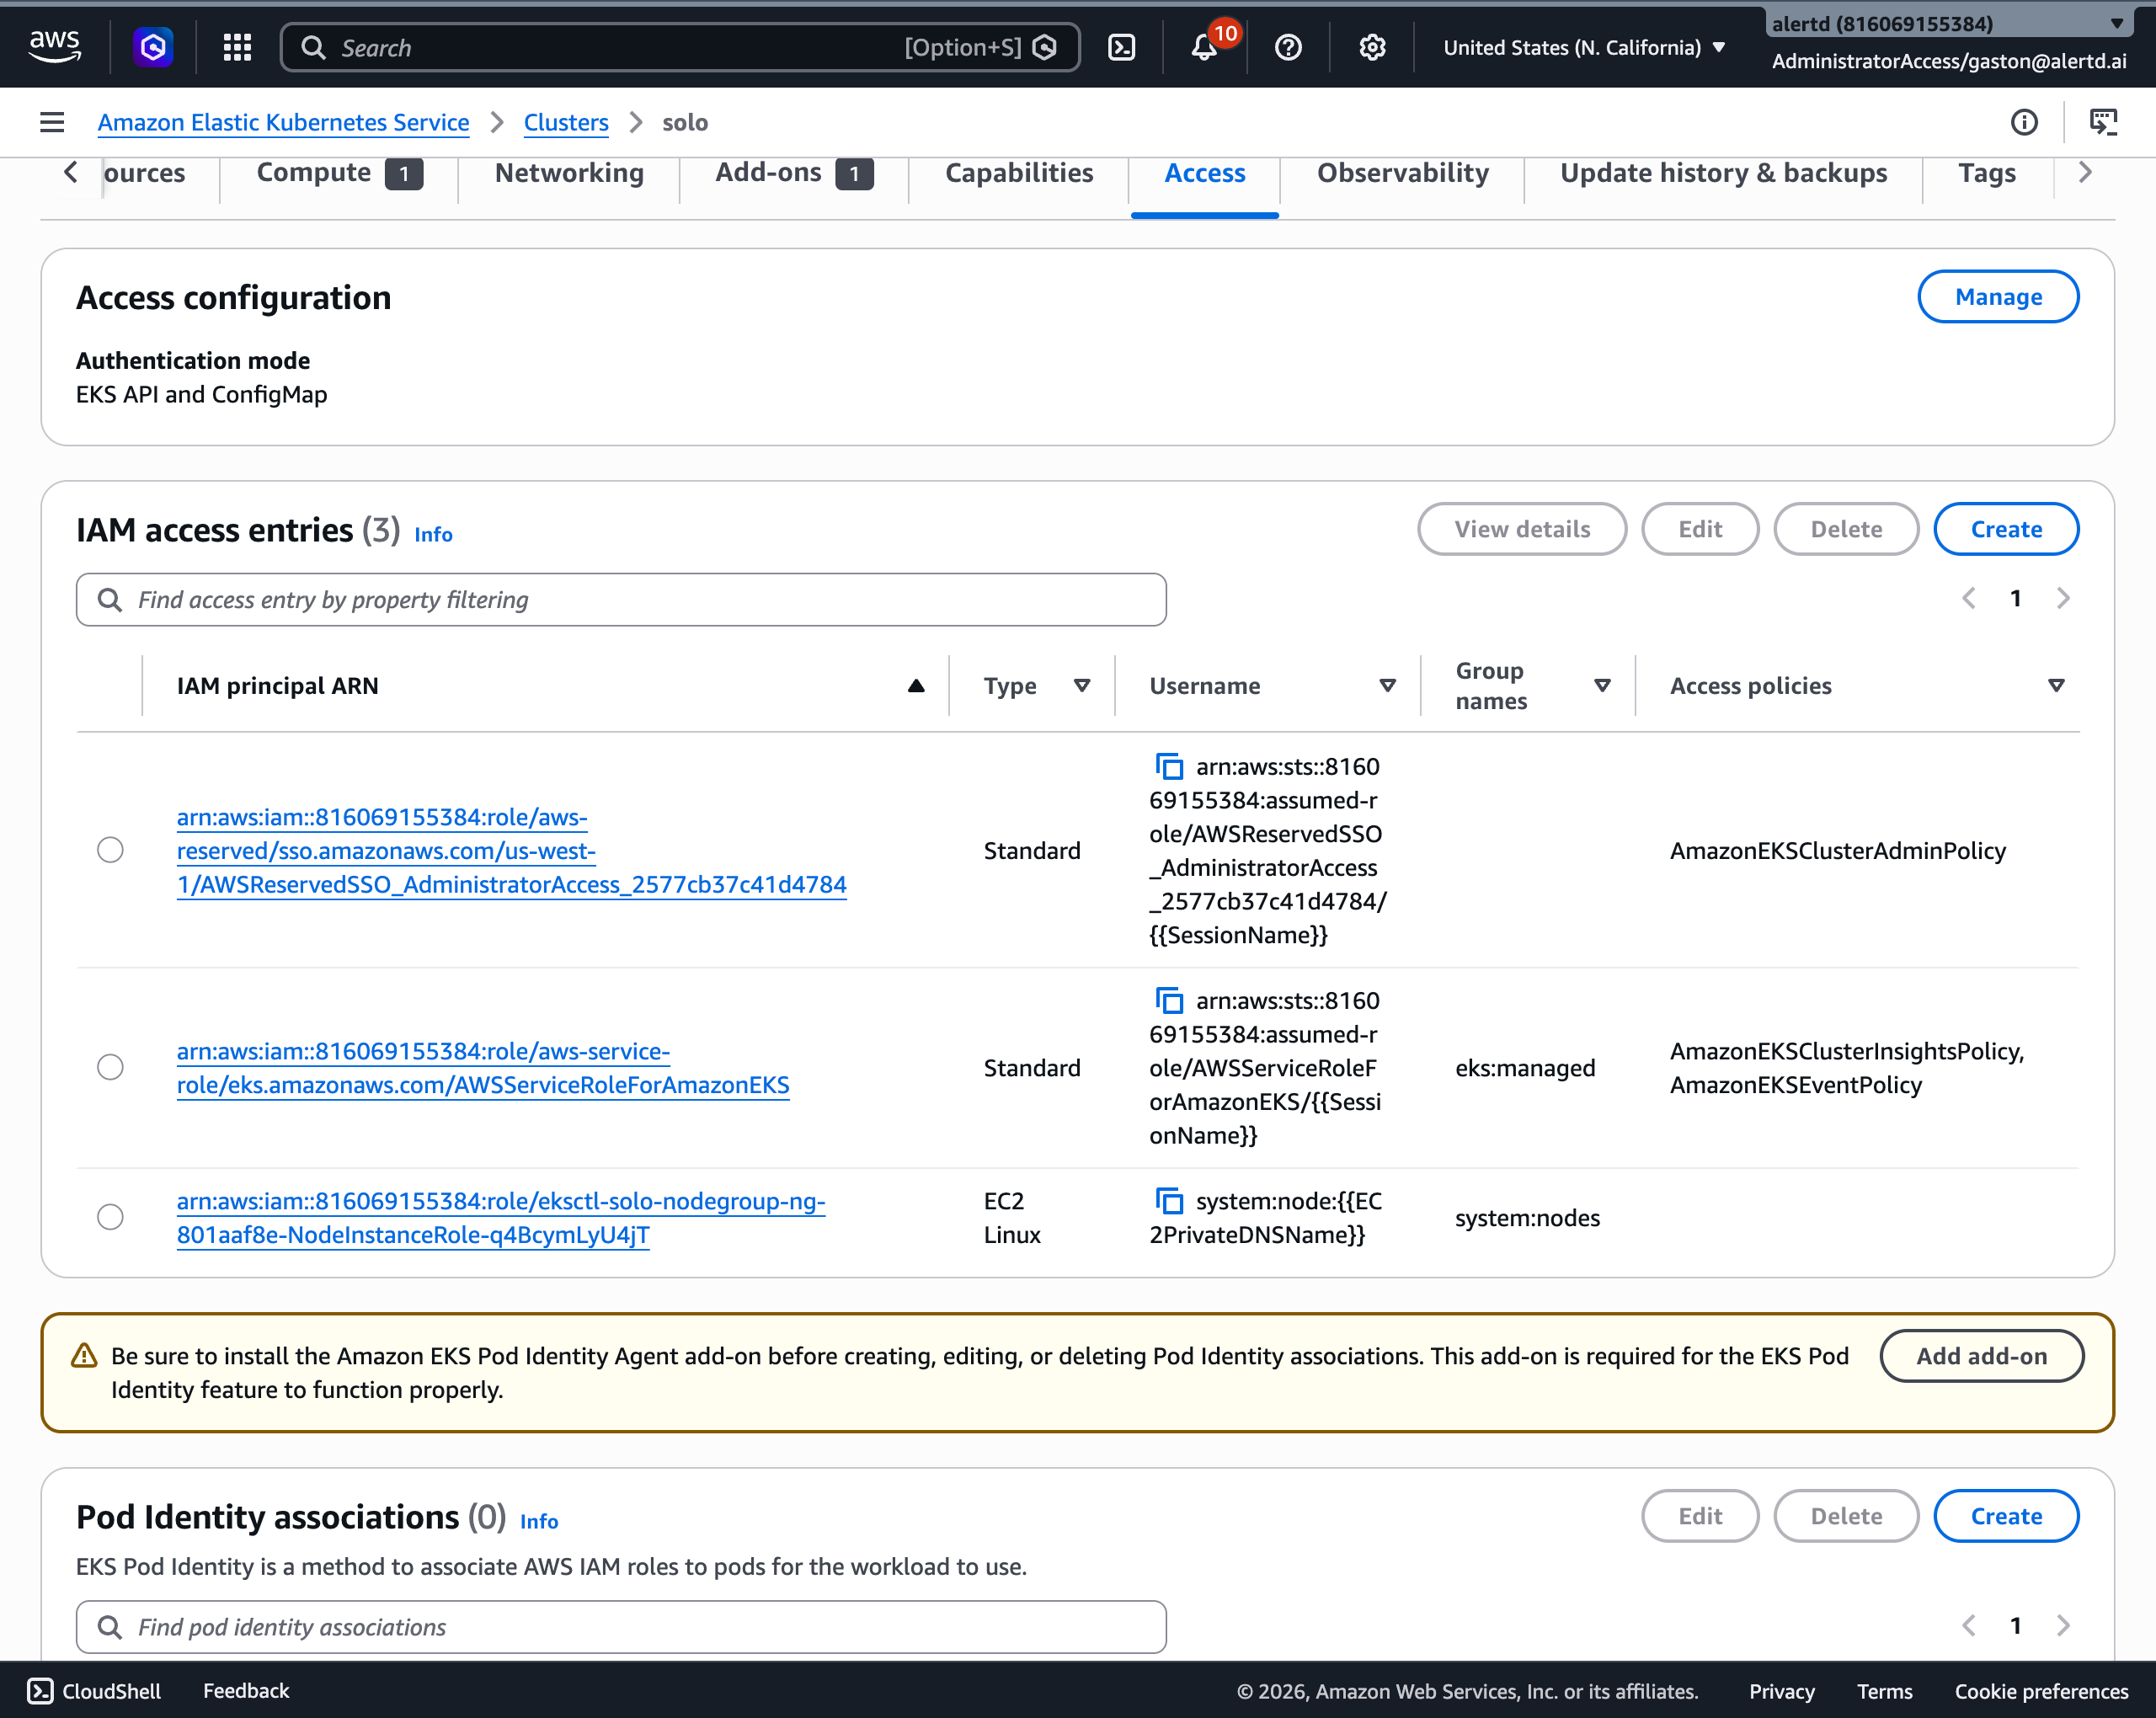
Step 2.2: Configure the access entry
- In IAM principal ARN, paste the AlertD TaskRole ARN from Step 1.
- Leave Type as Standard.
- Choose Next.
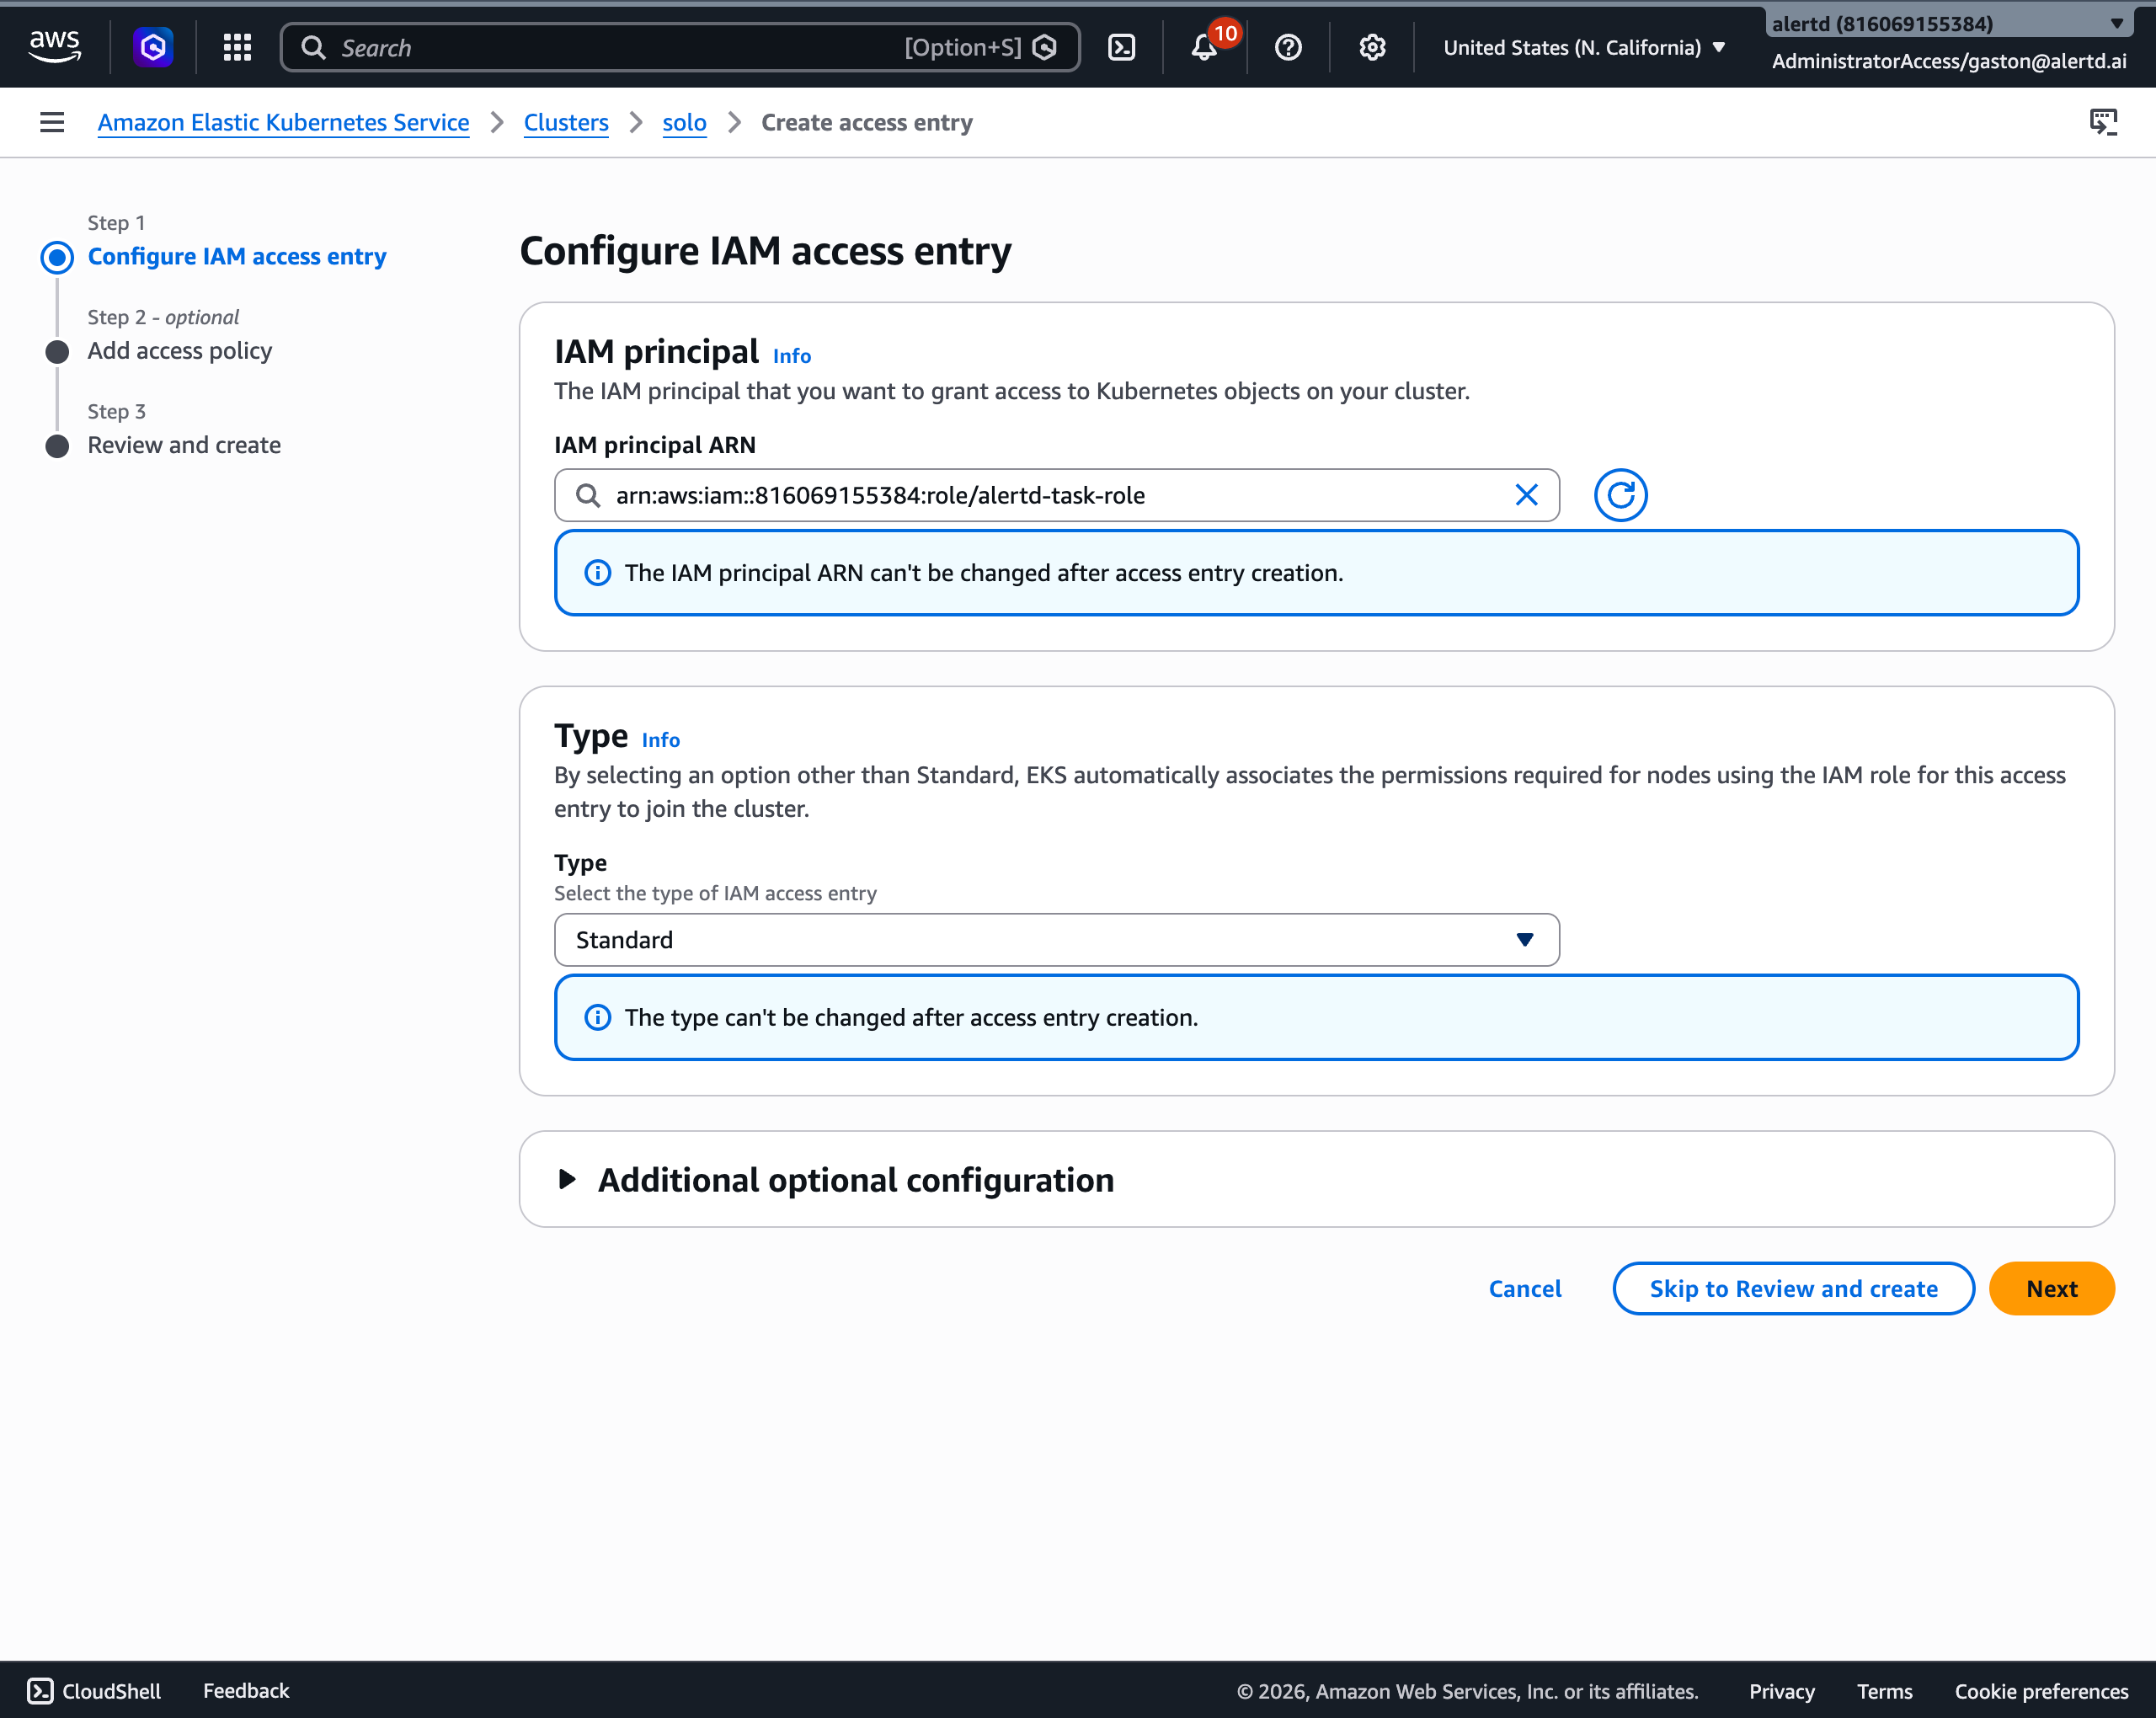
The IAM principal ARN and type can’t be changed after the access entry is created. Double-check the ARN before continuing.
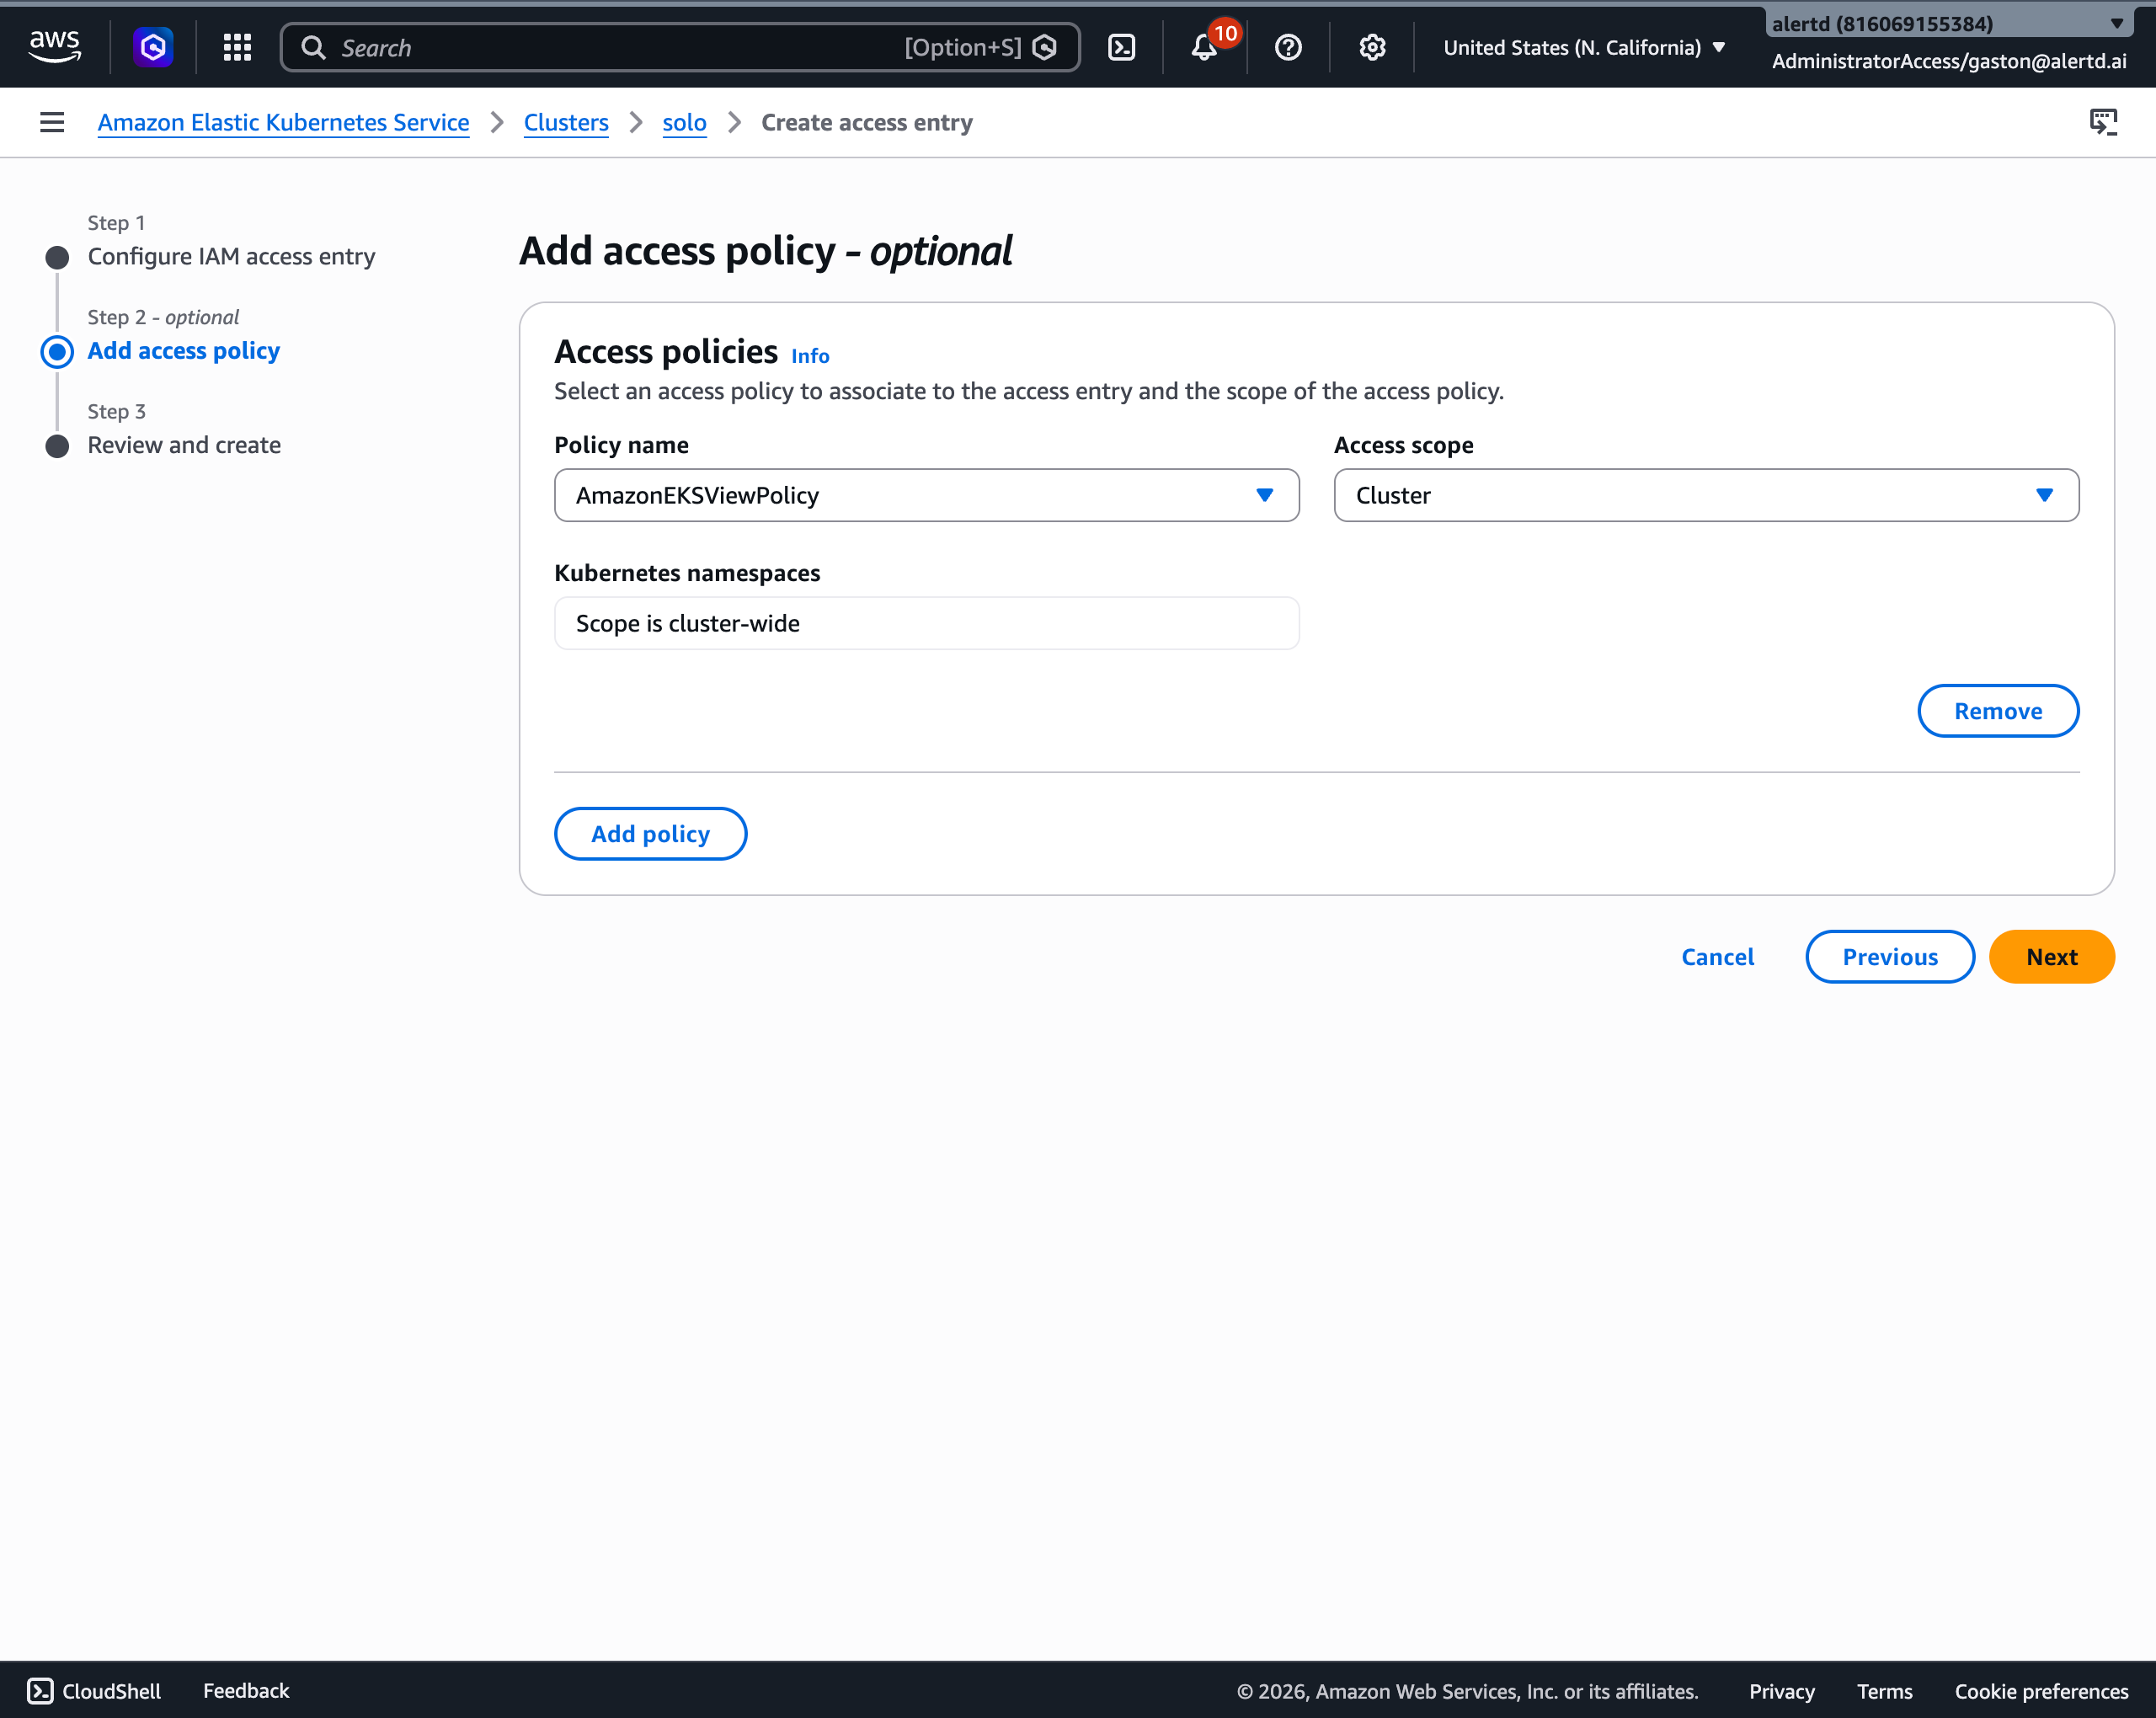
Step 2.3: Add a read-only access policy
- Choose Add policy.
- For Policy name, select AmazonEKSViewPolicy (read-only access to Kubernetes objects).
- For Access scope, choose Cluster so the policy applies cluster-wide.
- Choose Next.
Step 2.4: Review and create
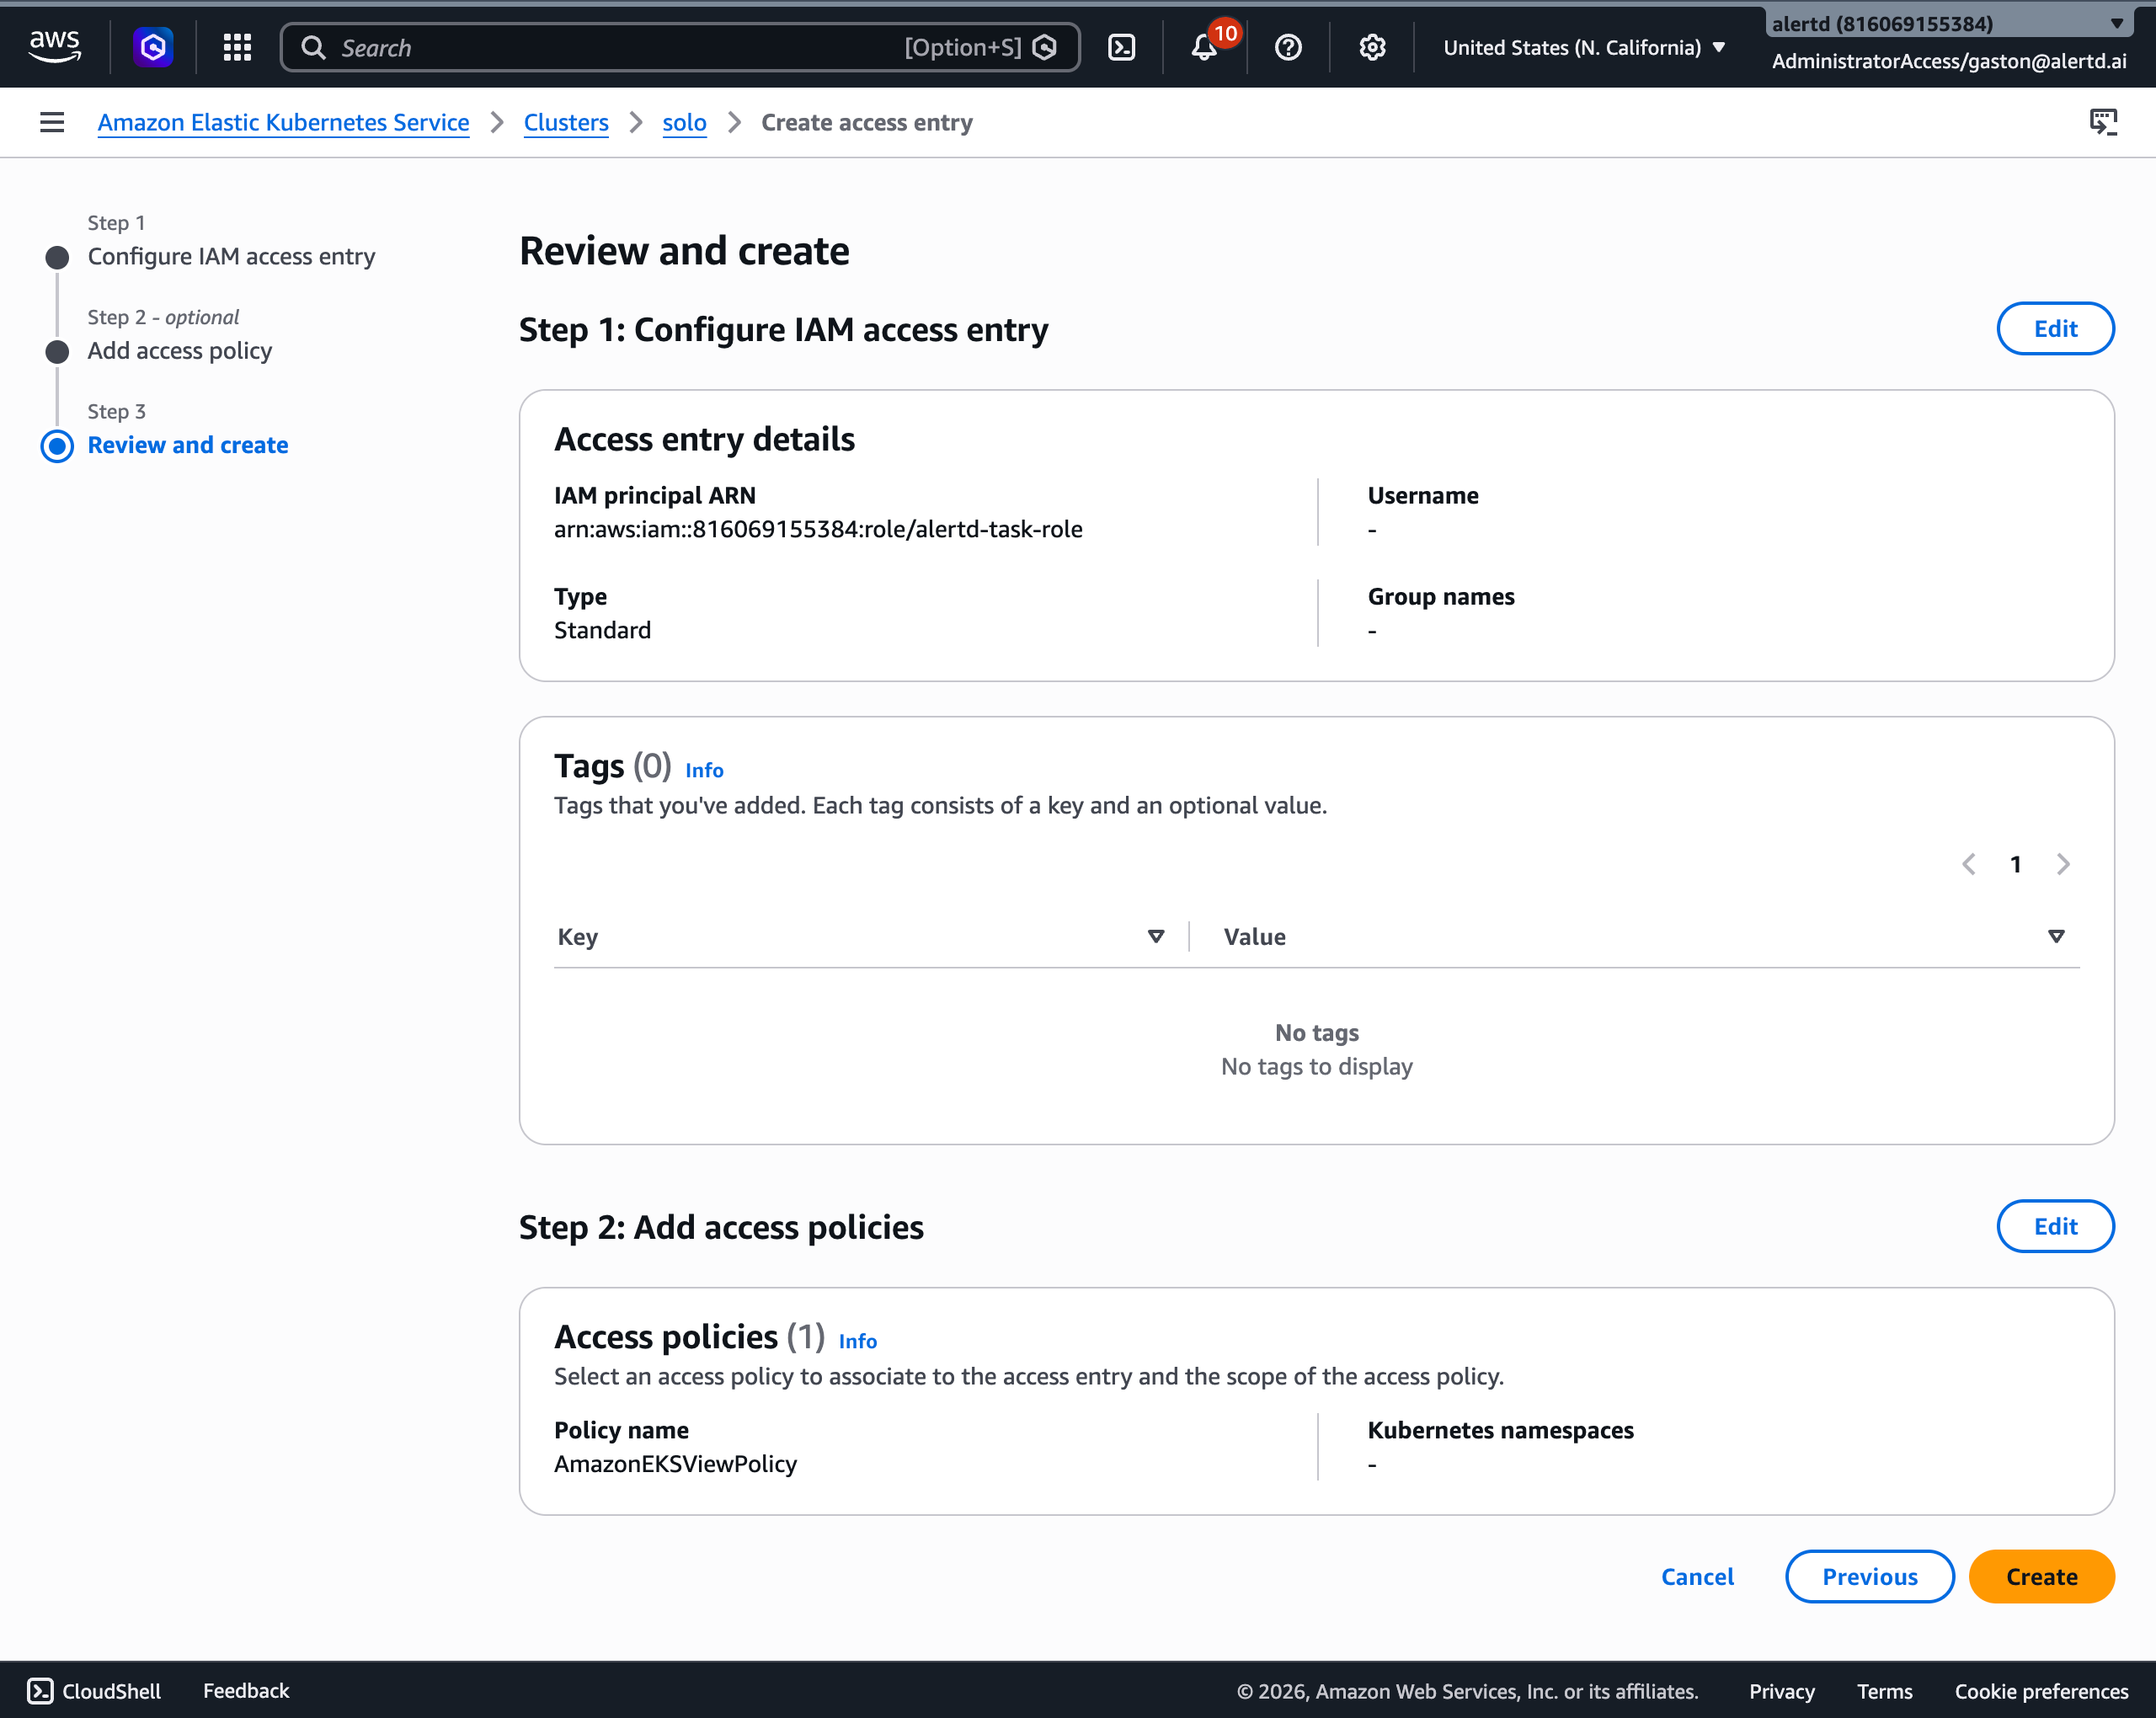
- Review the access entry and its policy.
- Choose Create.
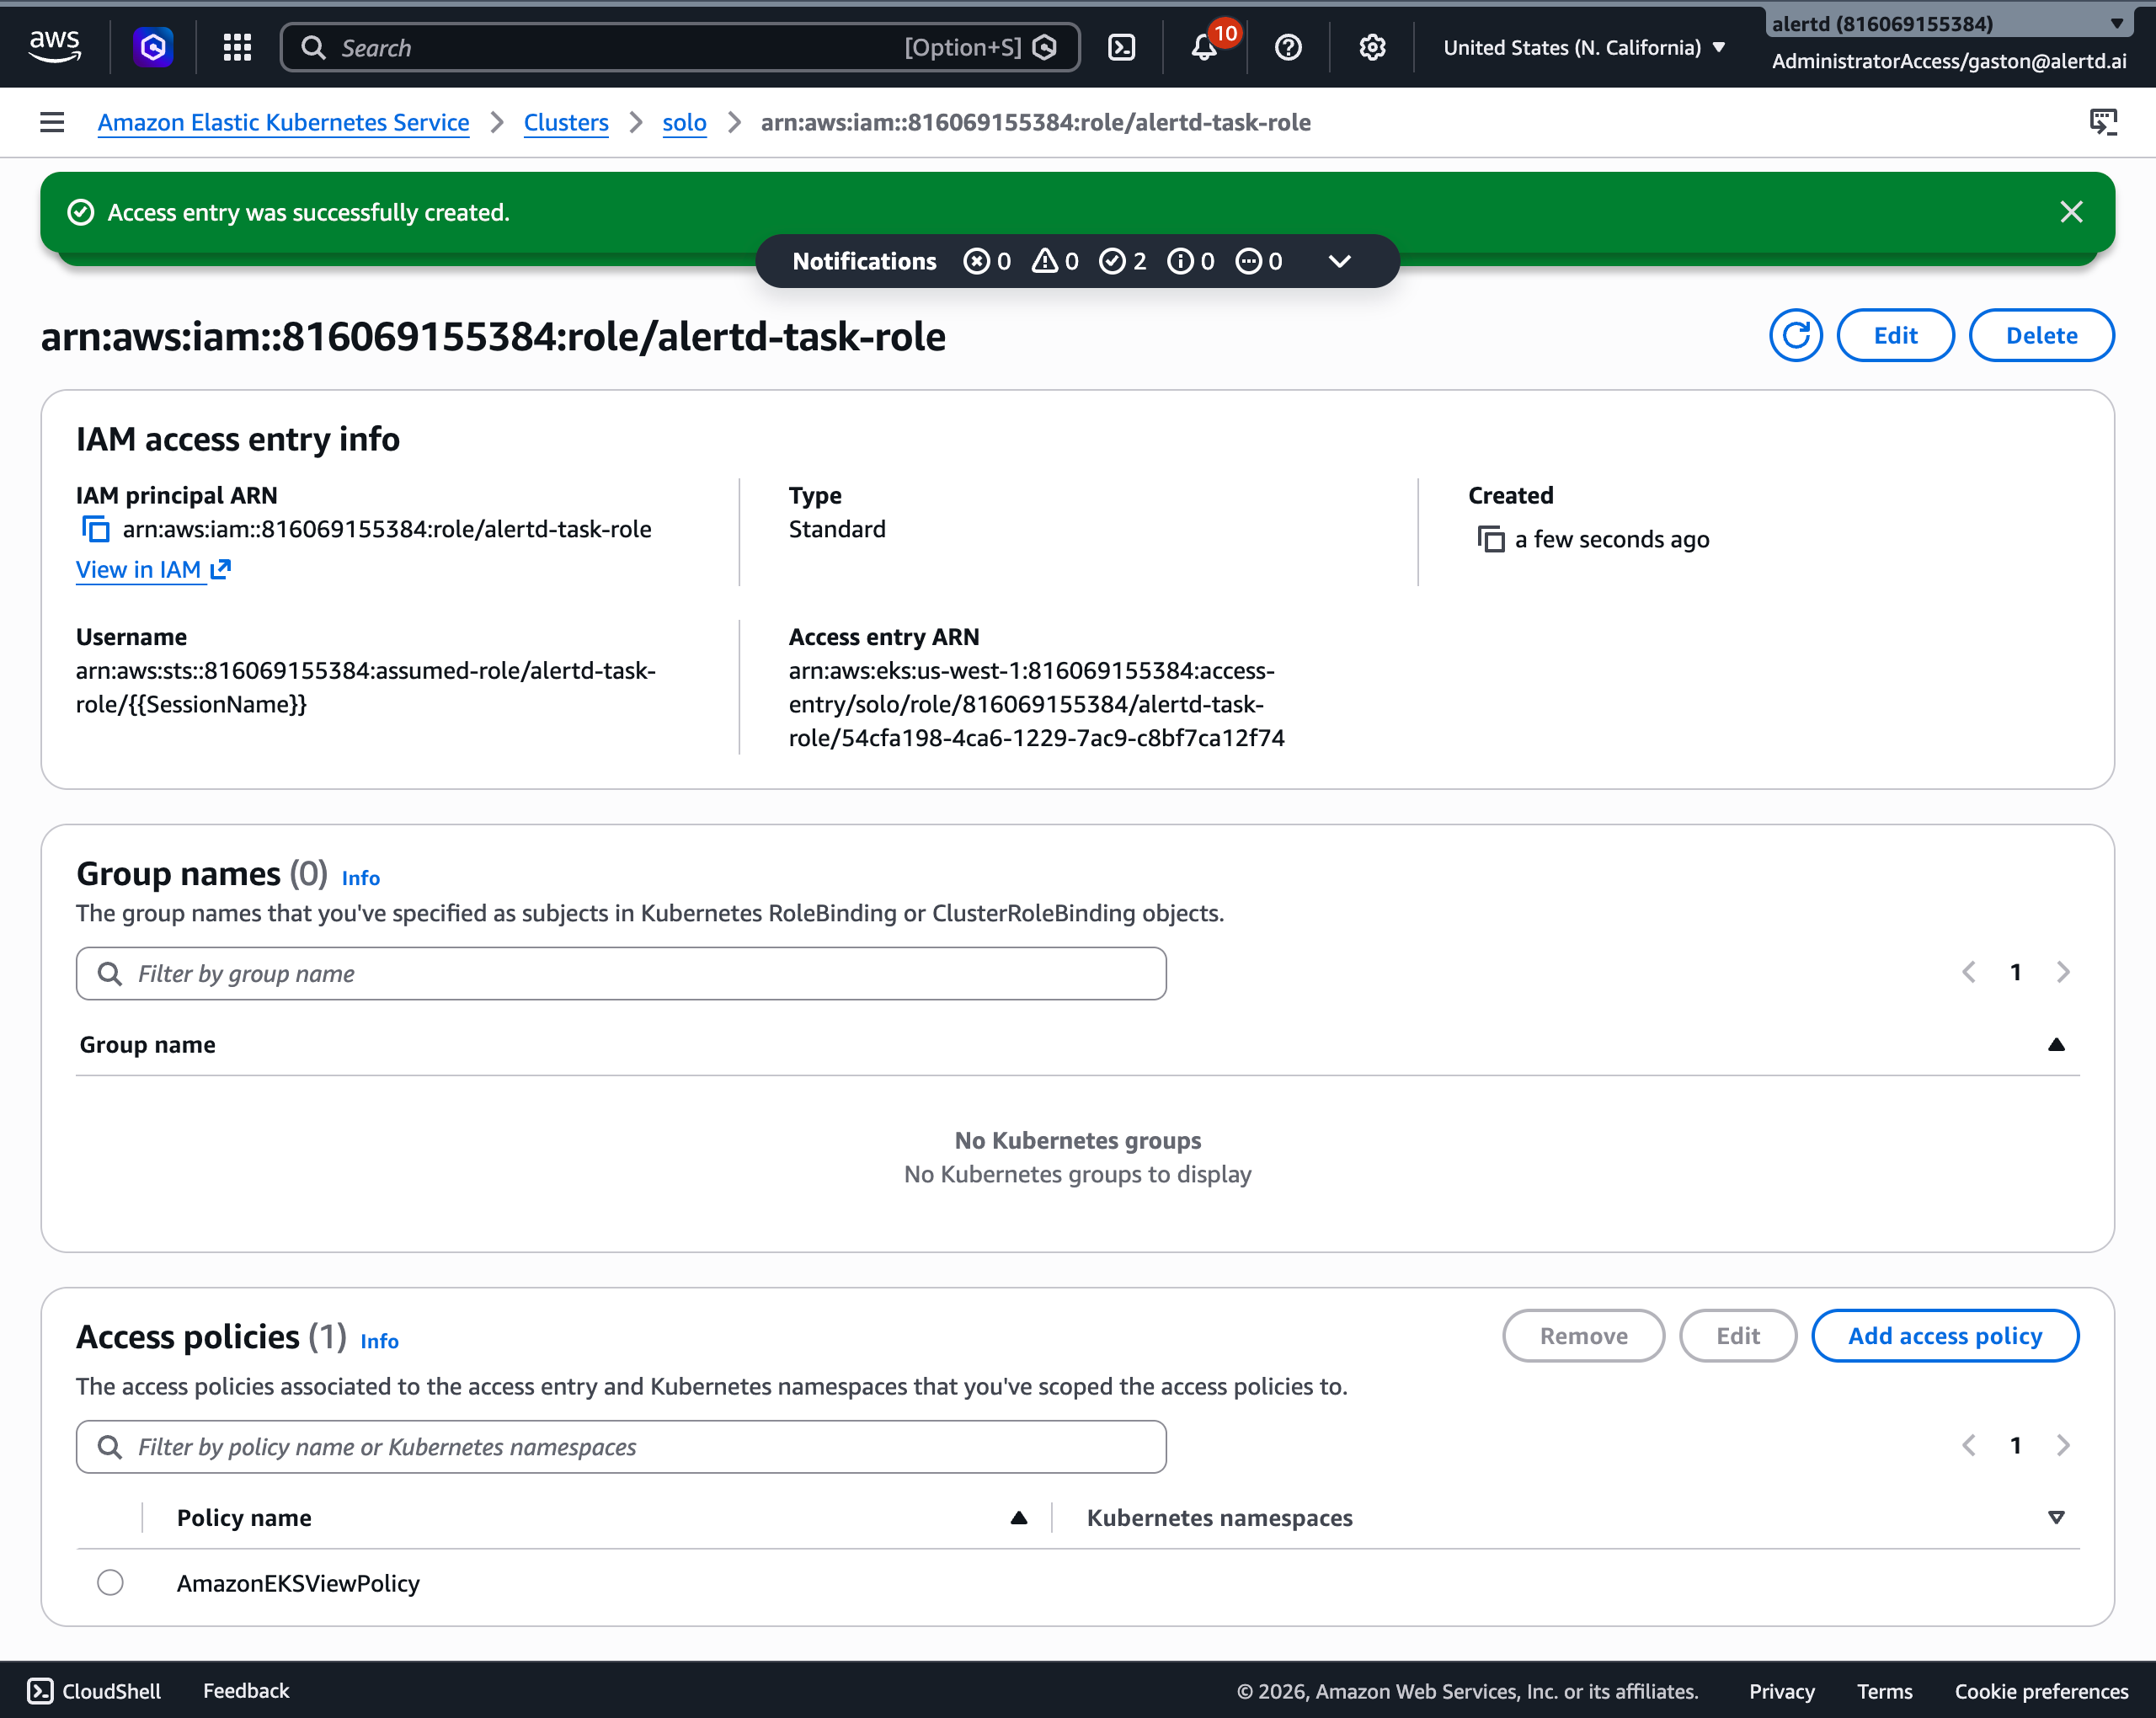
You’ll see a confirmation that the access entry was created, with AmazonEKSViewPolicy associated to the TaskRole.
Step 3: Add the CloudWatch Observability add-on
This add-on installs the CloudWatch Agent and enables Container Insights, which publishes cluster, node, pod, and container metrics to CloudWatch Metrics.
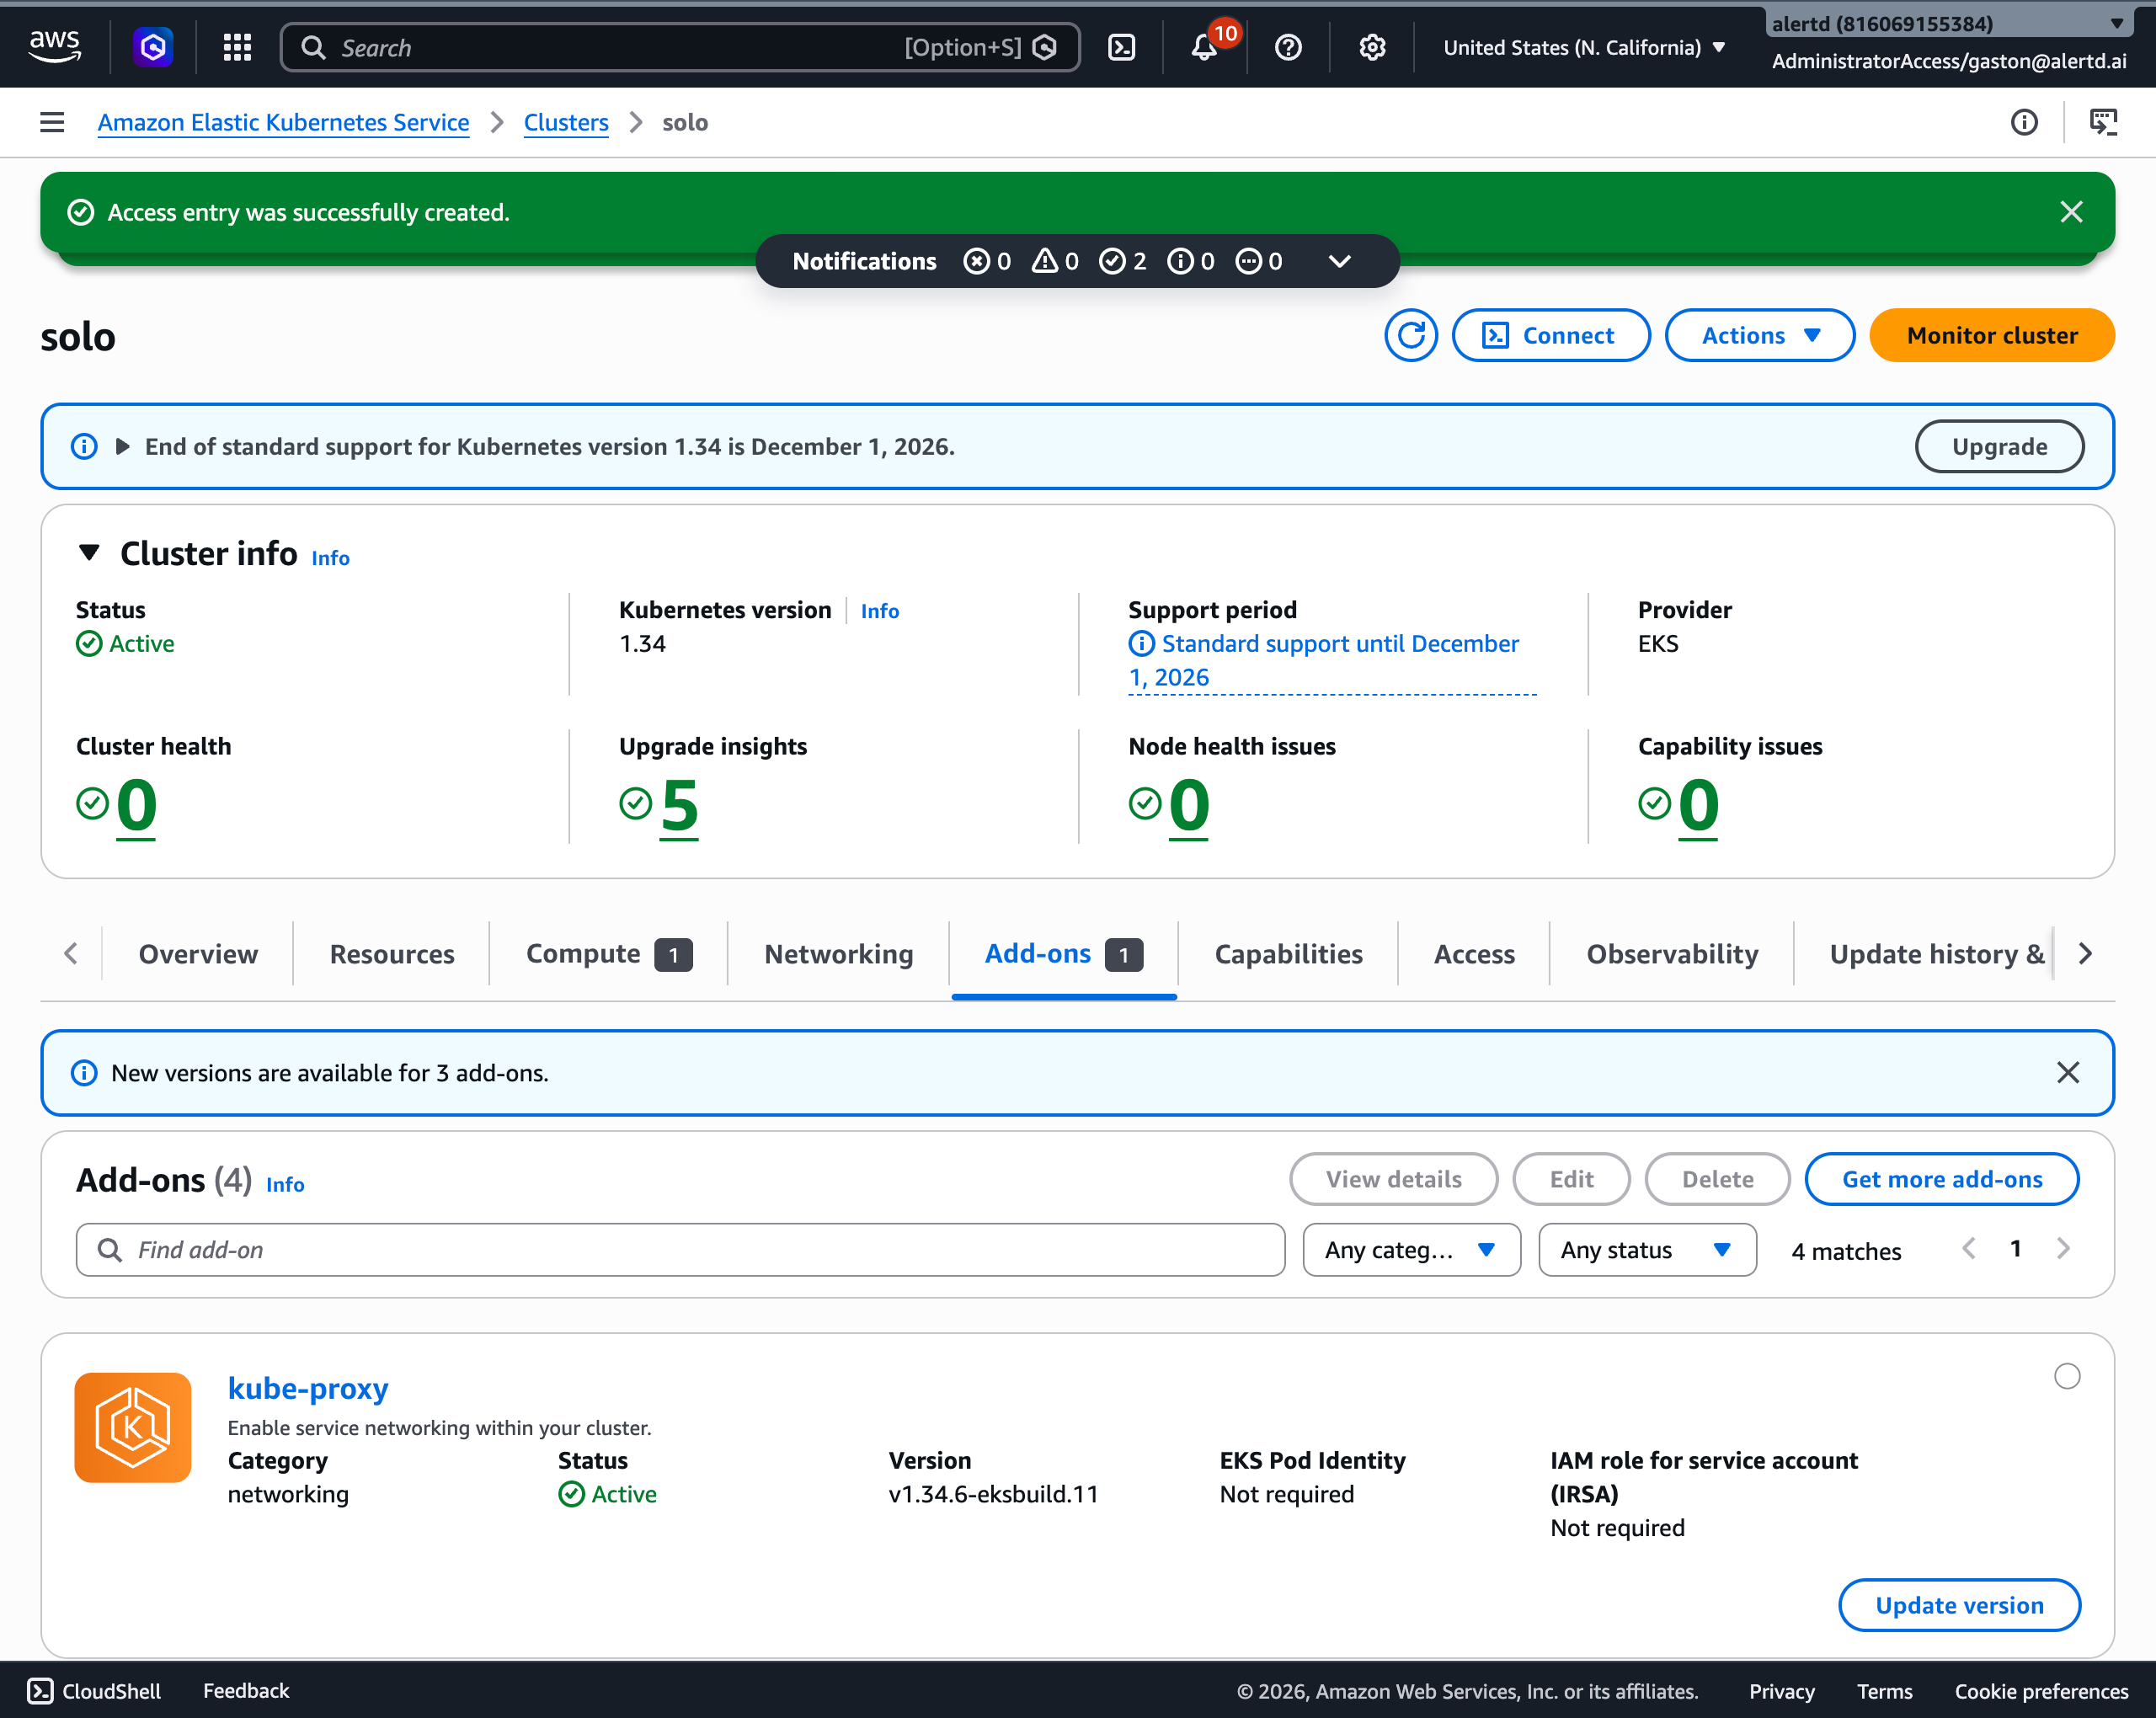
Step 3.1: Open the add-ons catalog
- On the cluster page, open the Add-ons tab and choose Get more add-ons.
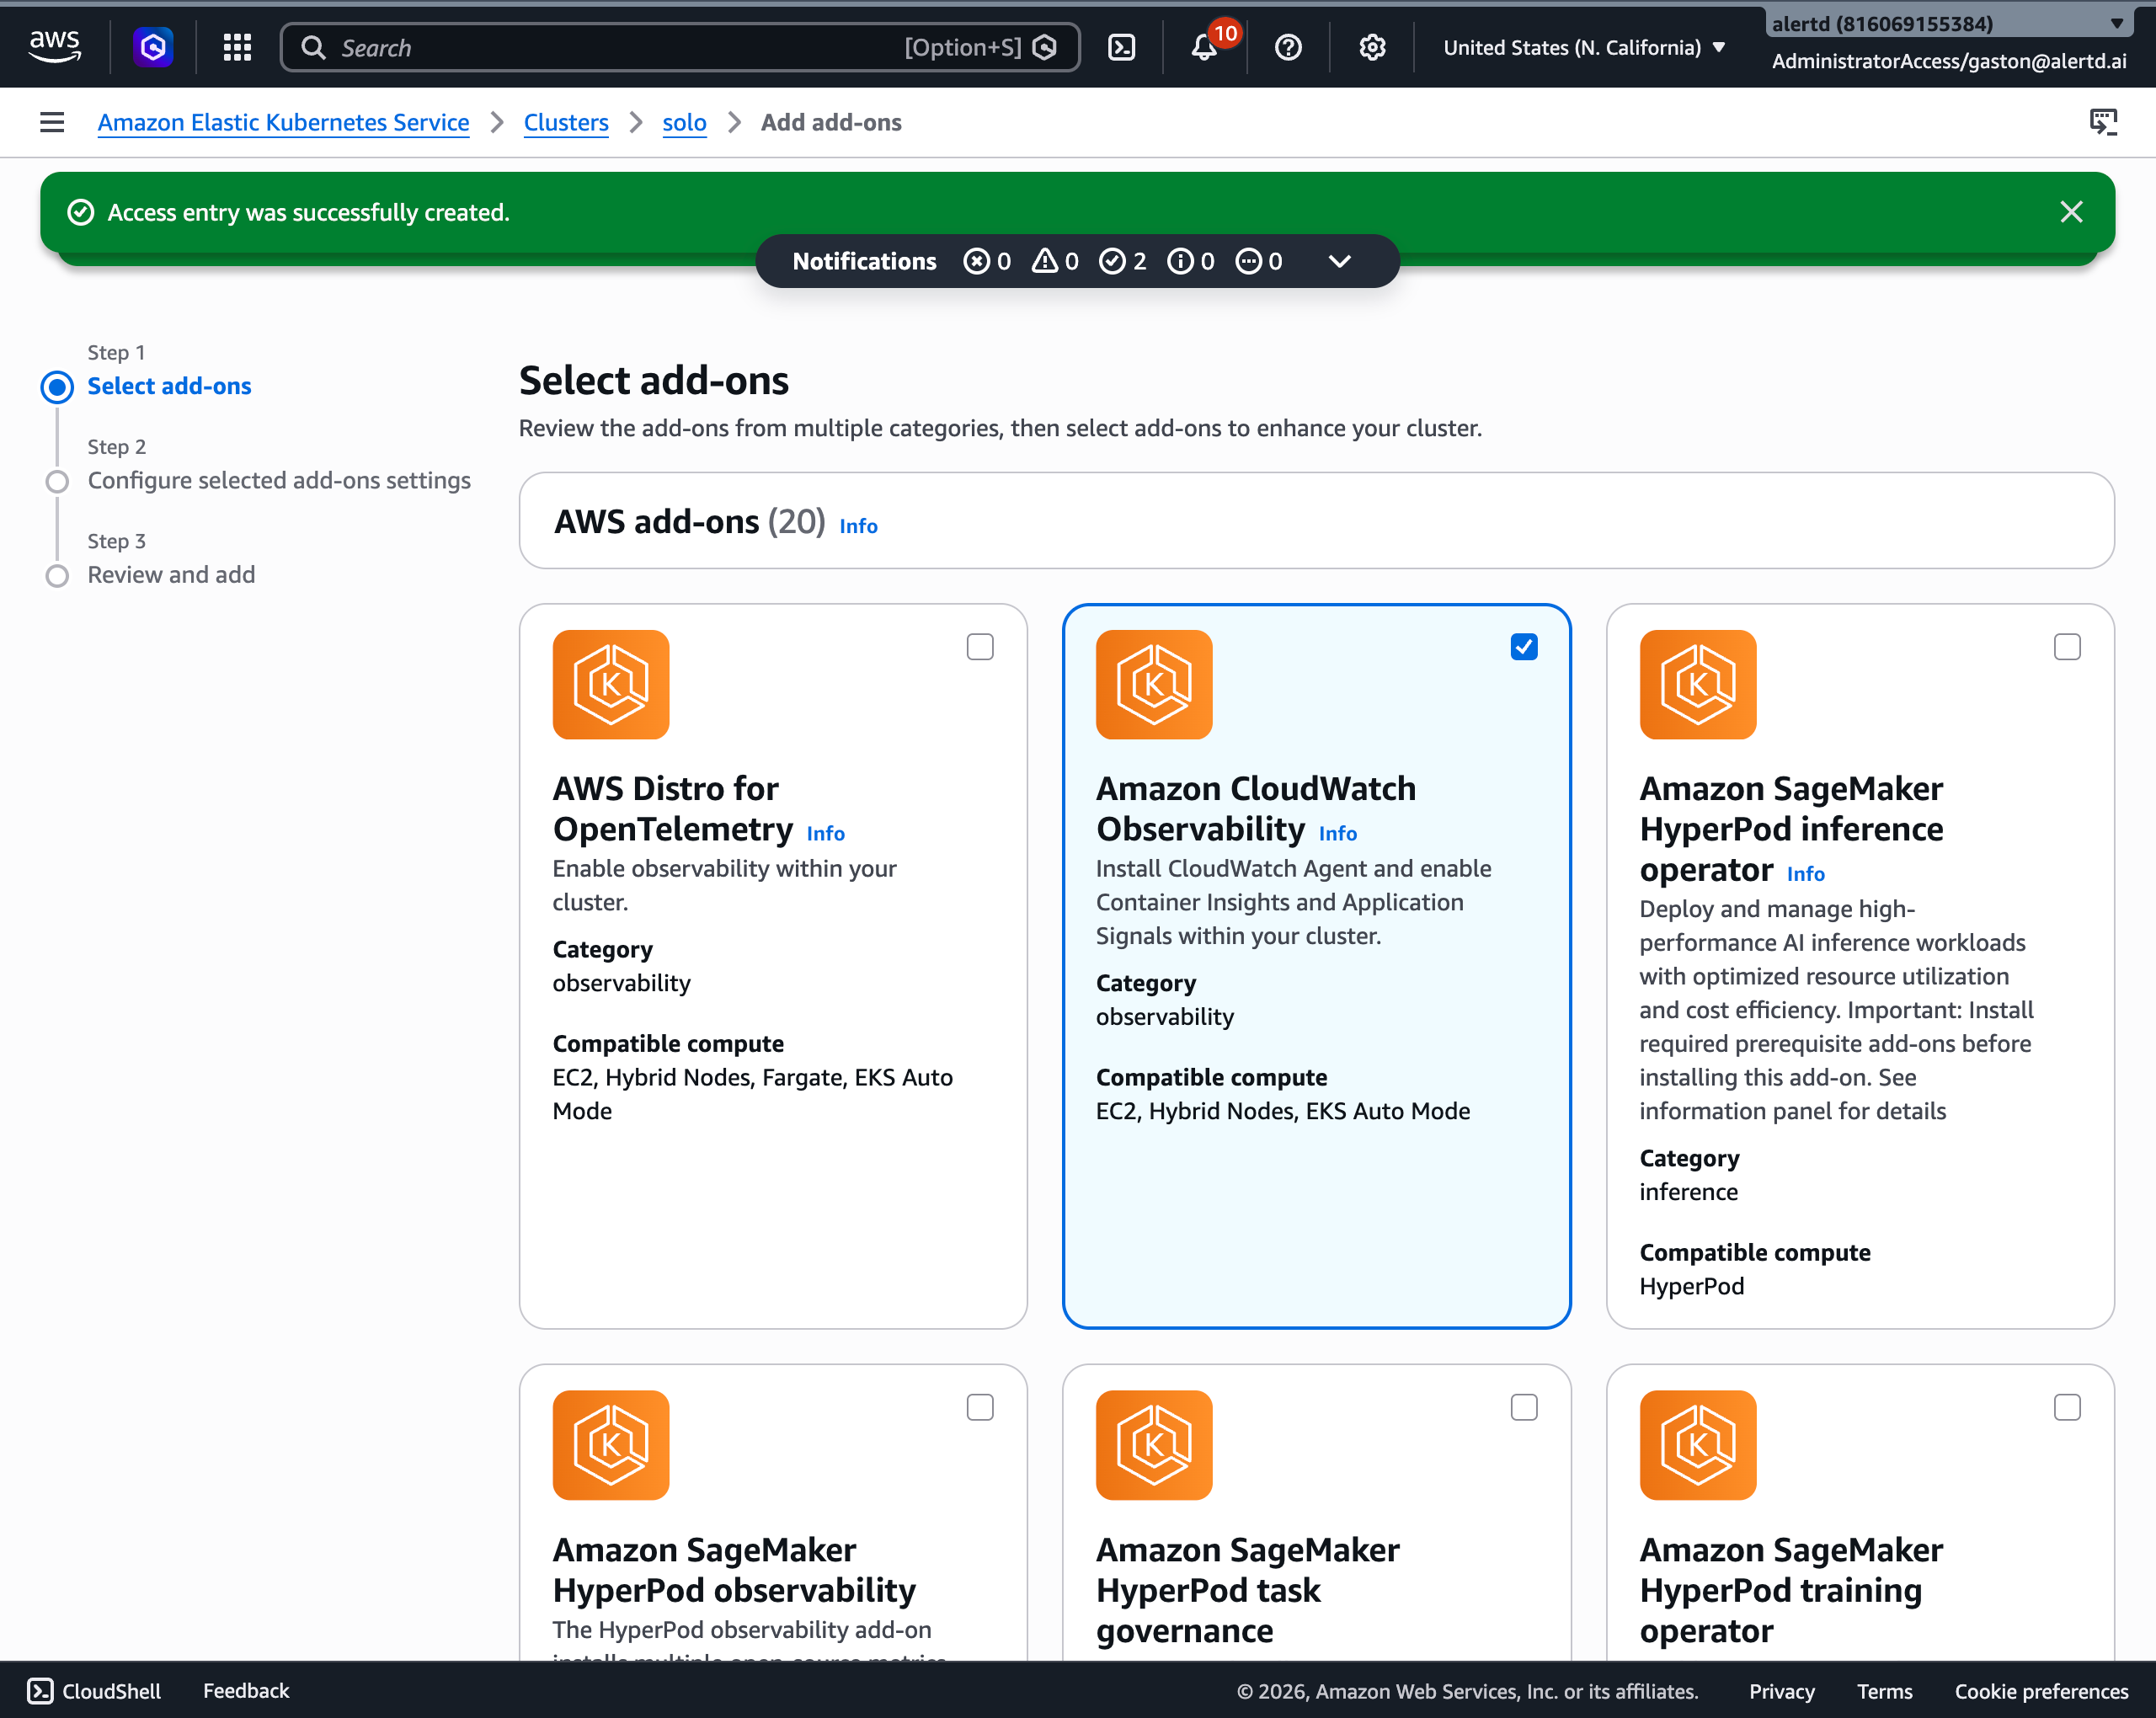
Step 3.2: Select Amazon CloudWatch Observability
- In the add-ons catalog, select Amazon CloudWatch Observability.
- Choose Next.
Step 3.3: Configure the add-on
- Keep the recommended Version.
- Under Add-on access, choose EKS Pod Identity.
- For the cloudwatch-agent service account role, keep the suggested
AmazonEKSPodIdentityAmazonCloudWatchObservabilityRole(or use Create new role if none exists). - Choose Next.
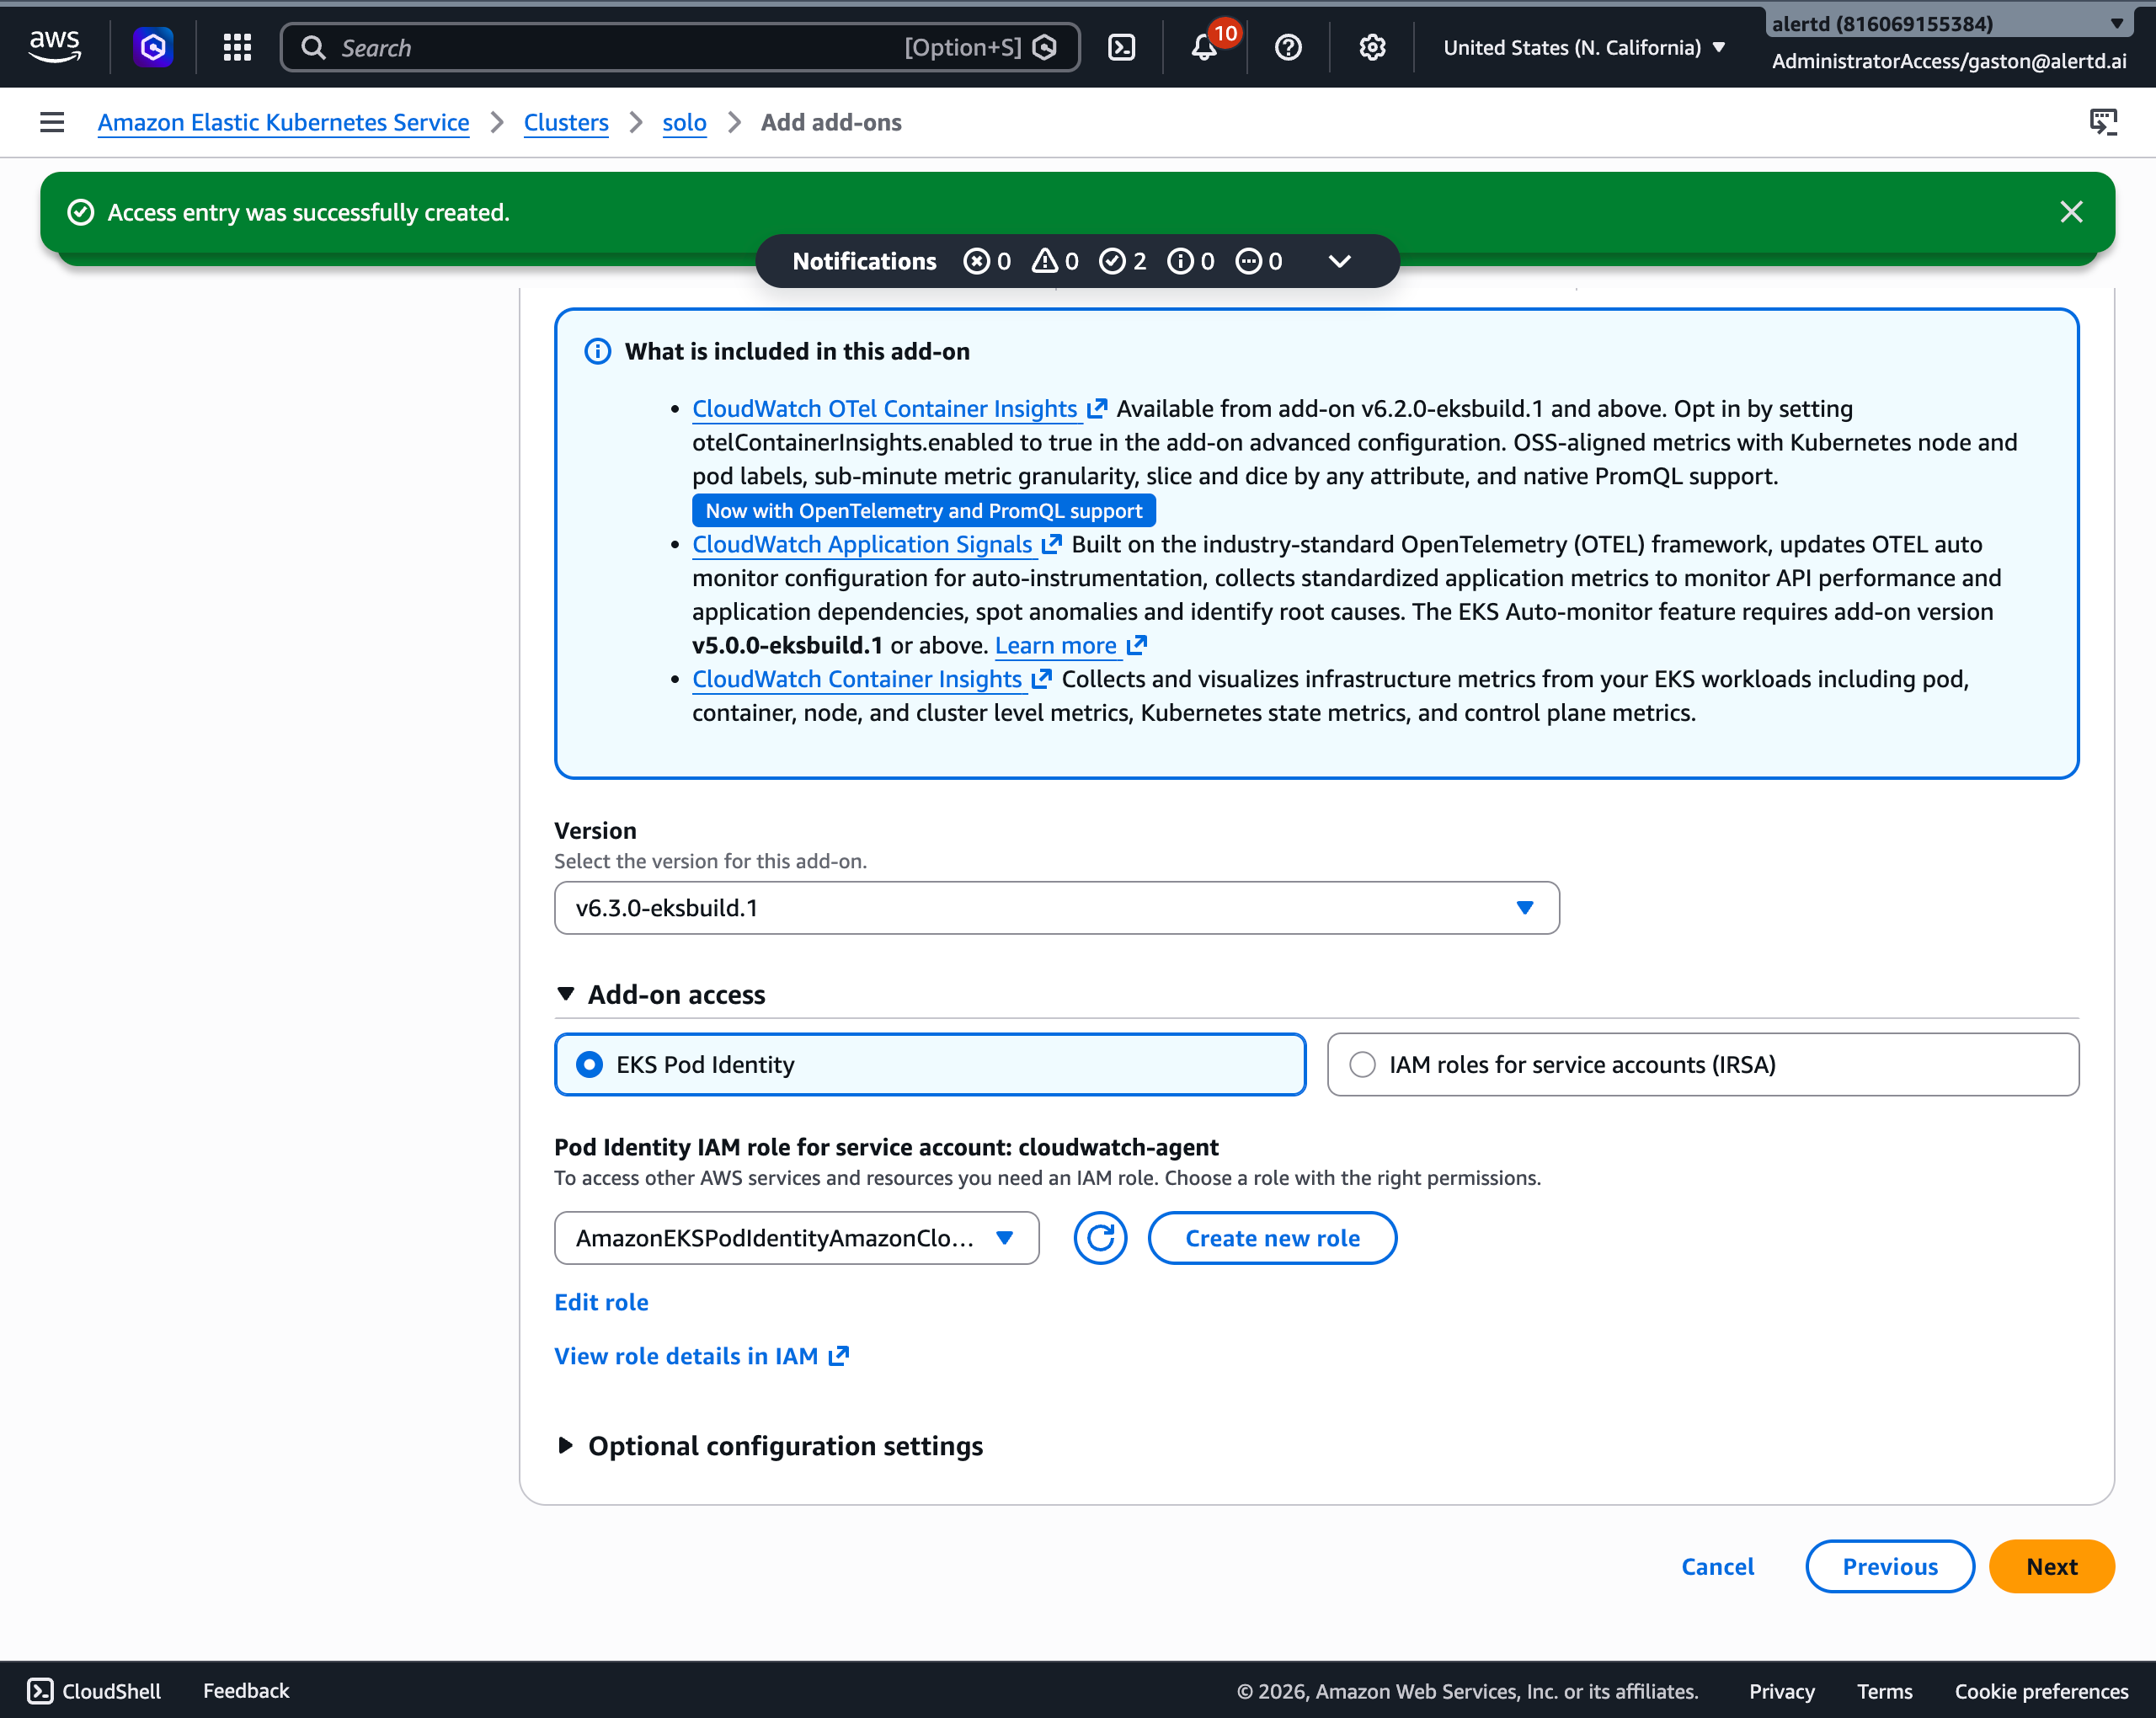
If you don’t already have an appropriate IAM role, choose Create new role — EKS creates one with the CloudWatch Agent permissions and the required Pod Identity association automatically.
Step 3.4: Review and add
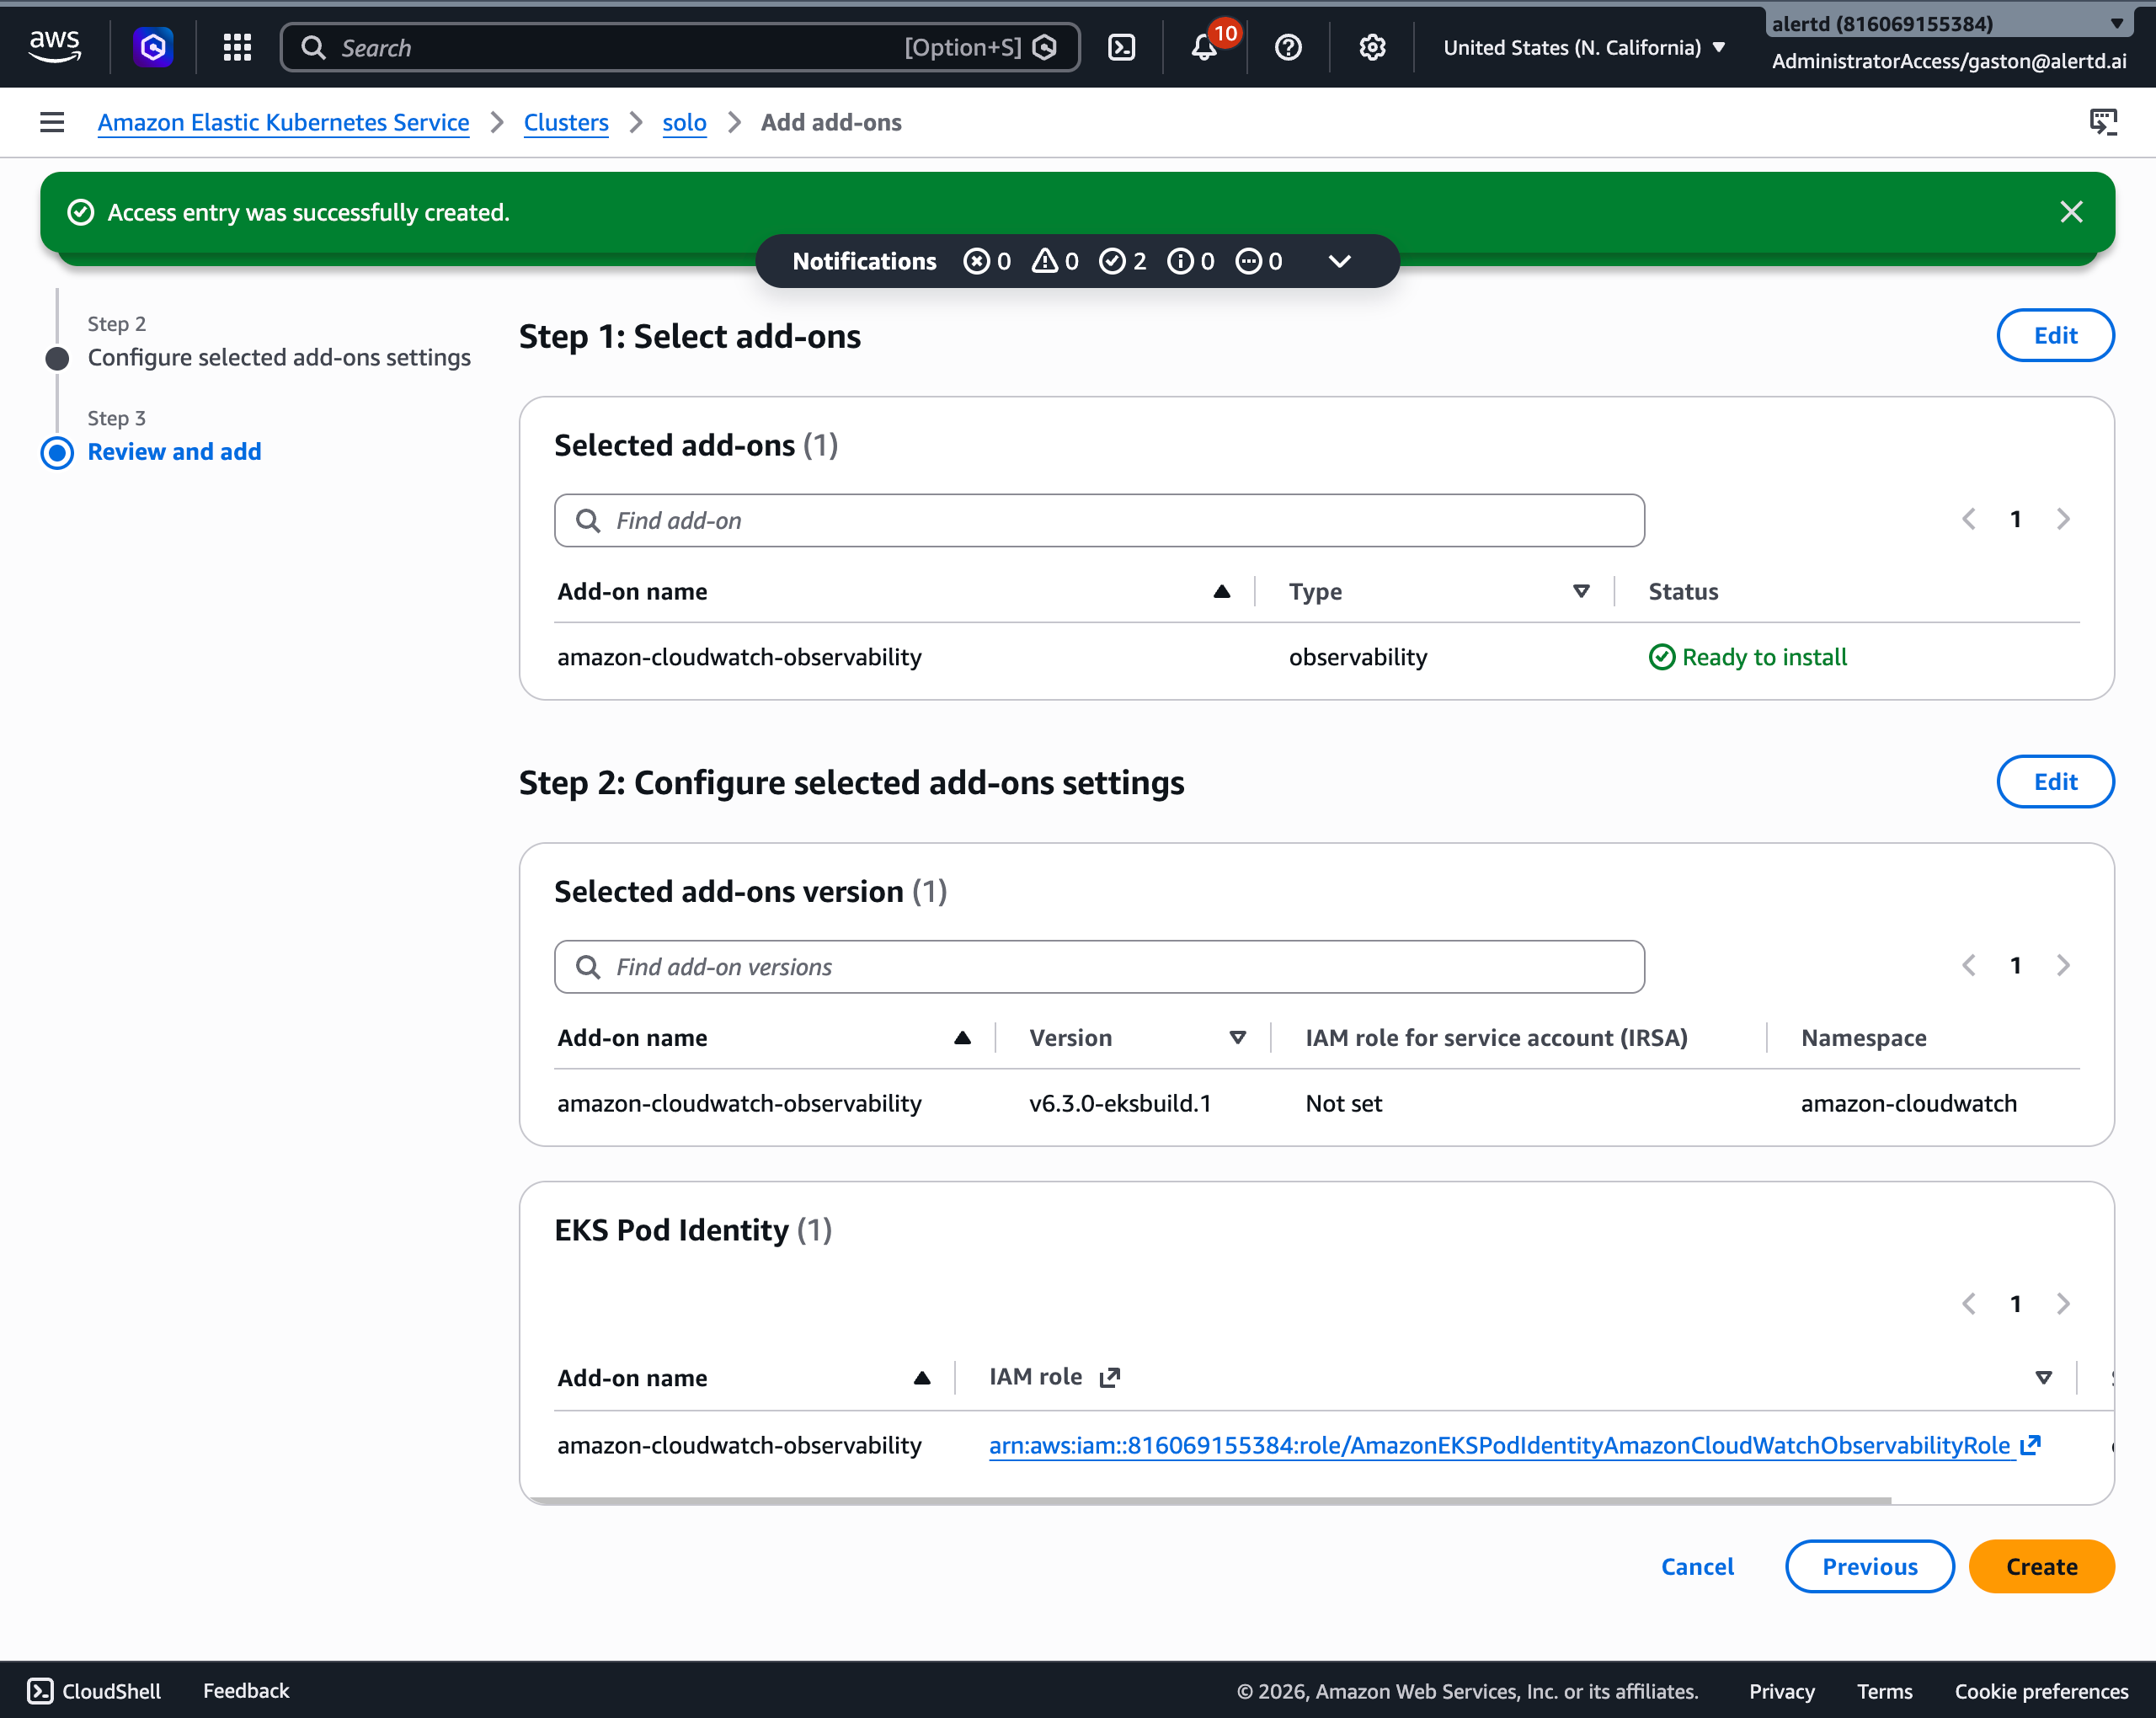
- Review the selected add-on, version, and IAM role.
- Choose Create.
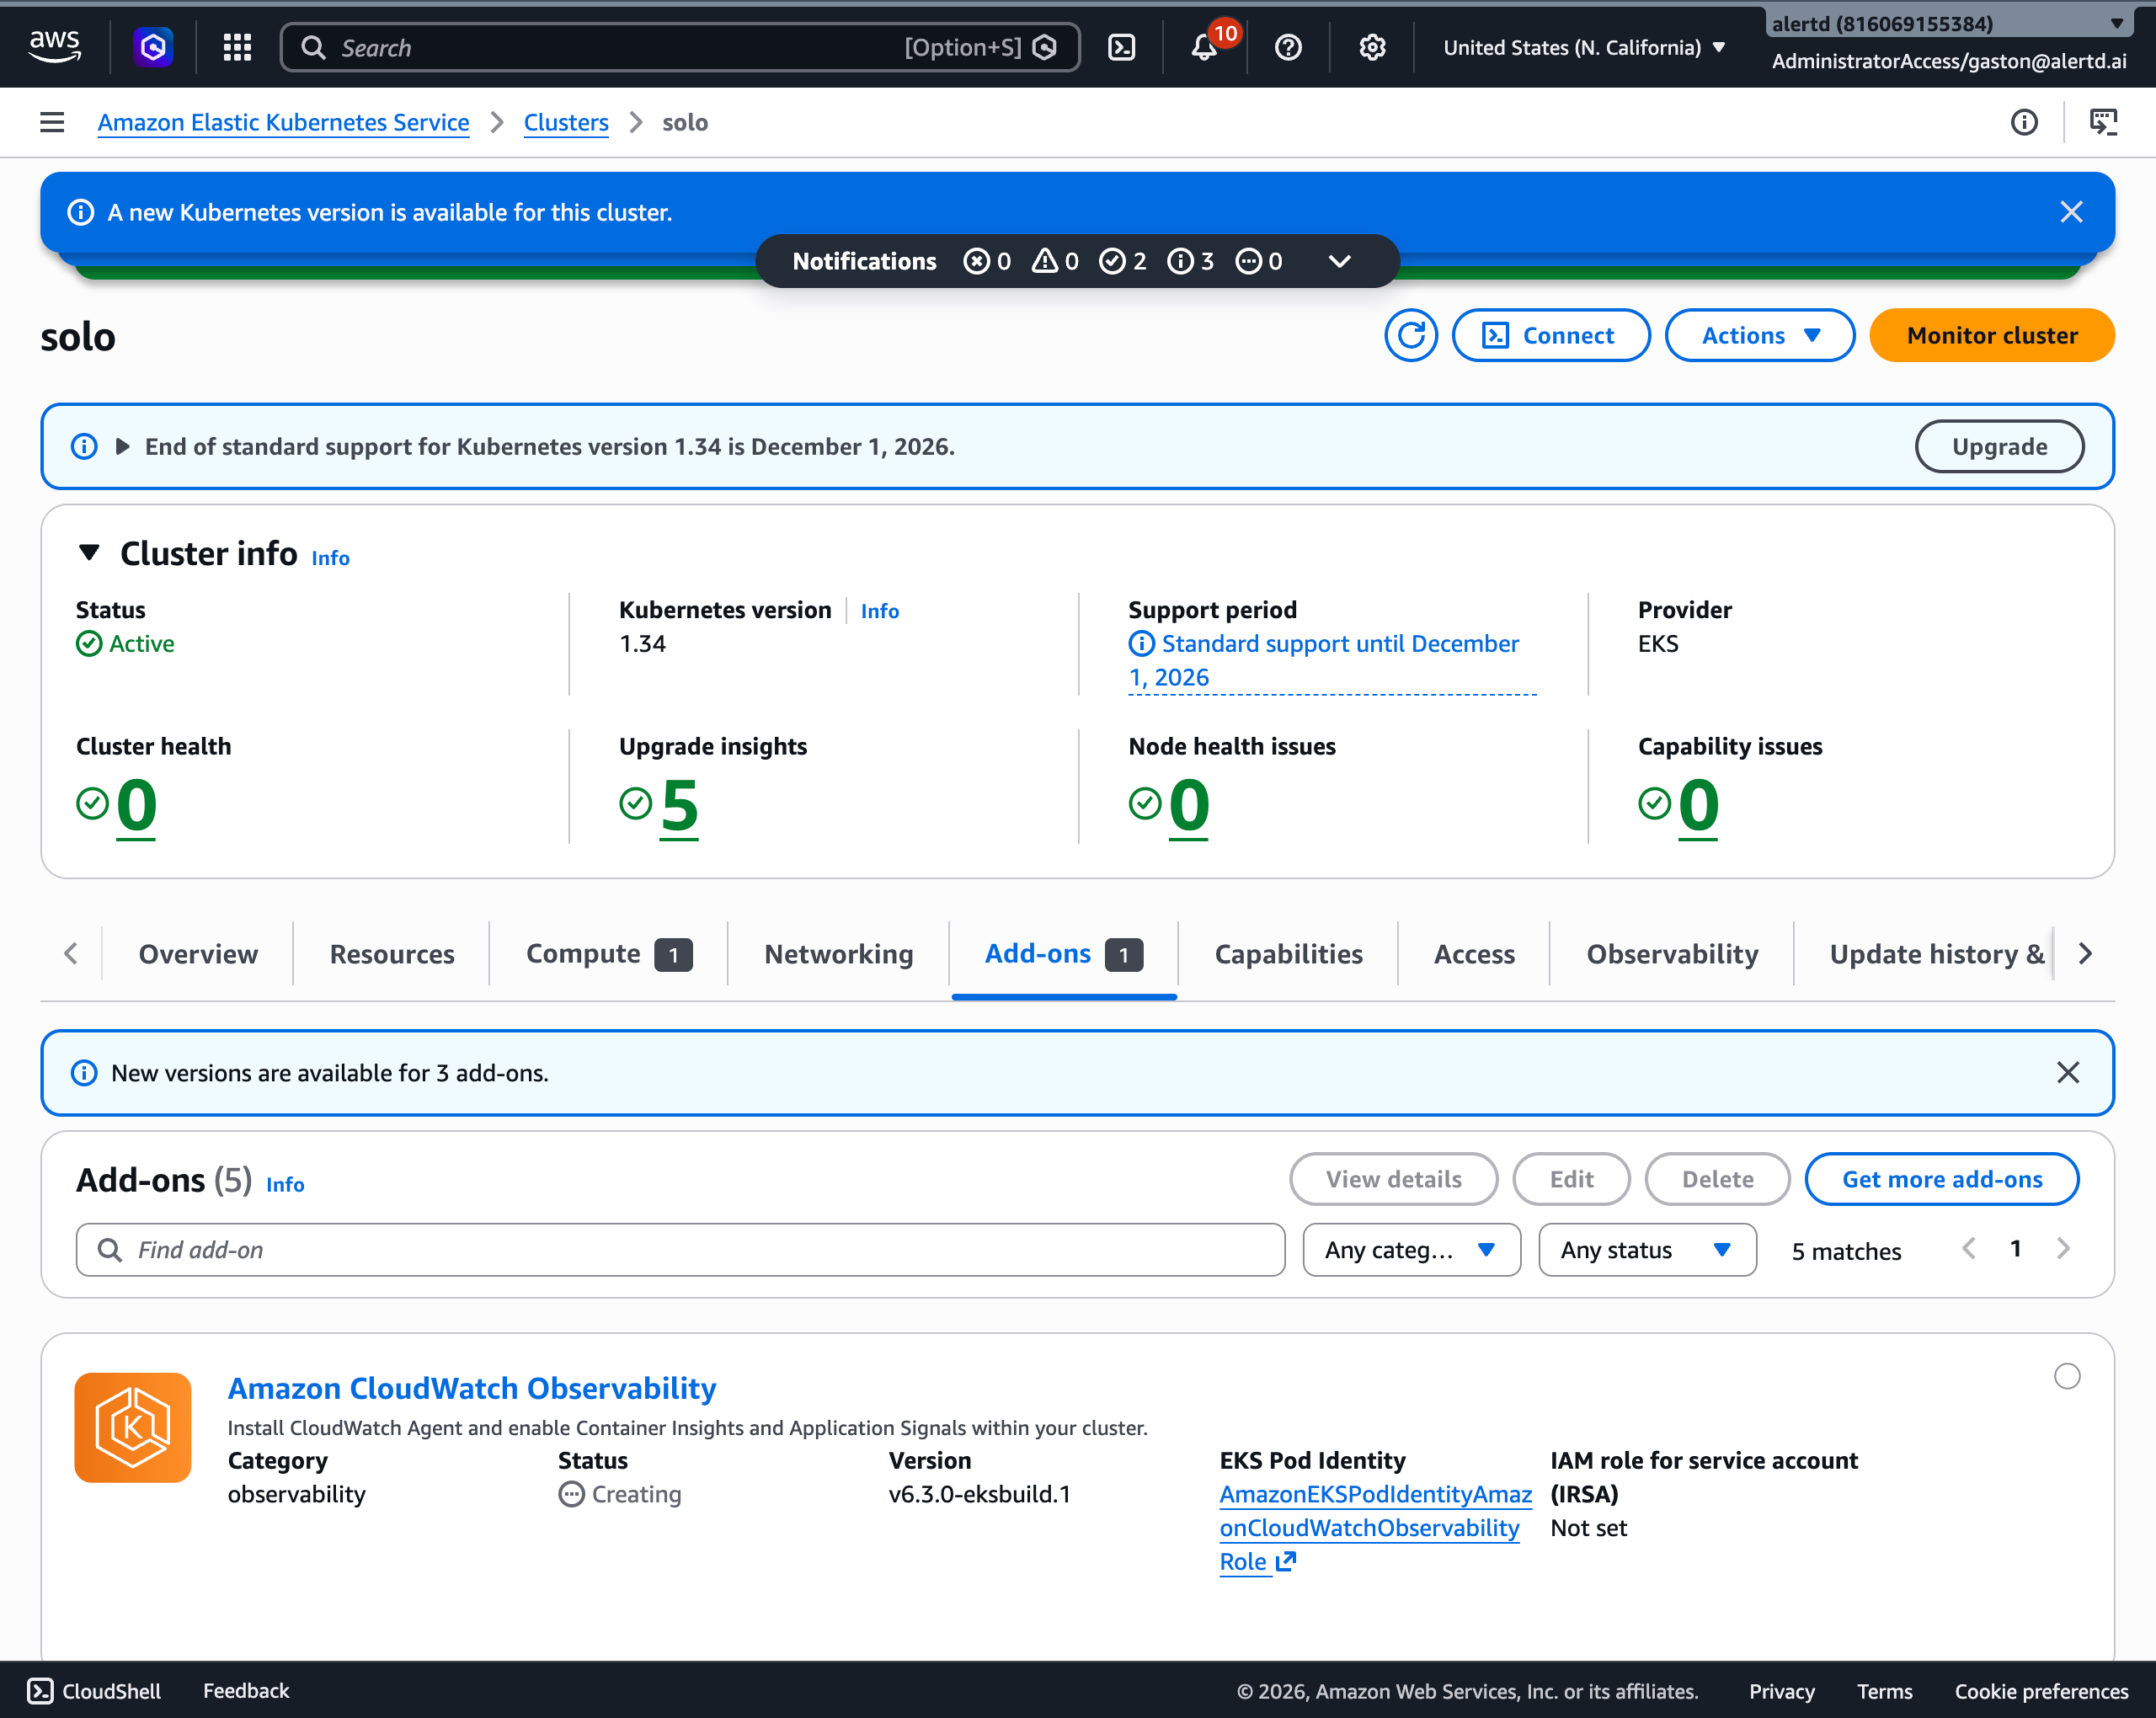
The add-on shows a status of Creating, then Active once the CloudWatch Agent is running.
Verify
Within a few minutes, the CloudWatch Agent begins publishing Container Insights metrics to CloudWatch under the ContainerInsights namespace. On AlertD’s next ingestion cycle, your EKS cluster and its metrics become available — you can then ask questions about cluster health, node and pod resource usage, and workload behavior.